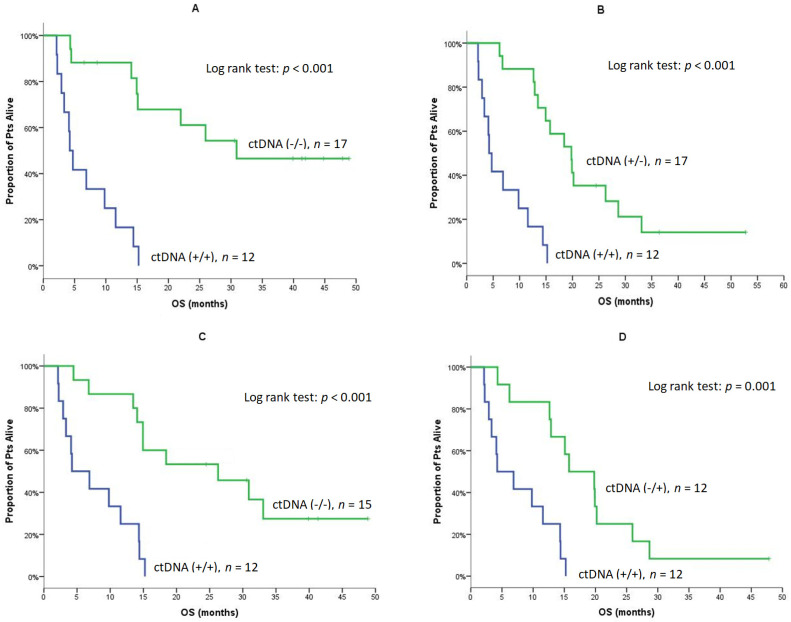
Figure 4.
OS of patients according to changes of ctDNA at Baseline, Post-1 and at the EOT (A). Median OS of patients with detectable ctDNA at Baseline and Post-1 [Pre (+)/Post-1 (+)] compered to those without detectable ctDNA at both time points [Pre (−)/Post-1 (−)]. (B) Median OS of patients with detectable ctDNA at Baseline and Post-1 [Pre (+)/Post-1 (+)] compared to those with detectable ctDNA at baseline and non-detactable ctDNA Post-1 [Pre (+)/Post-1 (−)]. (C) Median OS of patients with detectable ctDNA Post-1 and at the EOT [Post-1 (+)/EOT (+)] compared to patients without detectable ctDNA at both time points [Post-1 (−)/EOT (−)]. (D) Median OS of patients with detectable ctDNA Post-1 and at the EOT [Post-1 (+)/EOT (+)] compared to patients without detectable ctDNA at Post-1 and detectable ctDNA at the EOT [Post-1 (−)/EOT (+)].

