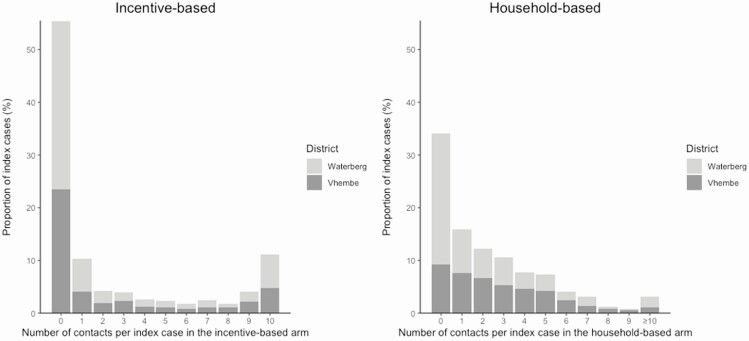
Figure 2.
Distribution of number of contacts among participants diagnosed with tuberculosis (“index participants”). The left panel shows the distribution of the number of contacts referred by each index participant in the incentive-based contact investigation arm, while the right panel shows the corresponding distribution in the household contact investigation arm. The distribution is split by districts—Waterberg (periurban) in light grey and Vhembe (rural) in dark grey. The overall mean number of contacts referred per case was similar between the 2 arms: 2.43 (95% confidence interval [95% CI], 2.18 to 2.69) in the incentive-based arm vs 2.33 (95% CI, 2.15 to 2.51) in the household-based arm. However, the proportion of index participants referring either zero (55% vs 34%) or ≥10 contacts (11% vs 3%) was higher in the incentive-based arm. By district, the proportion of index participants referring either zero or ≥10 contacts was higher in Waterberg than in Vhembe for both arms.

