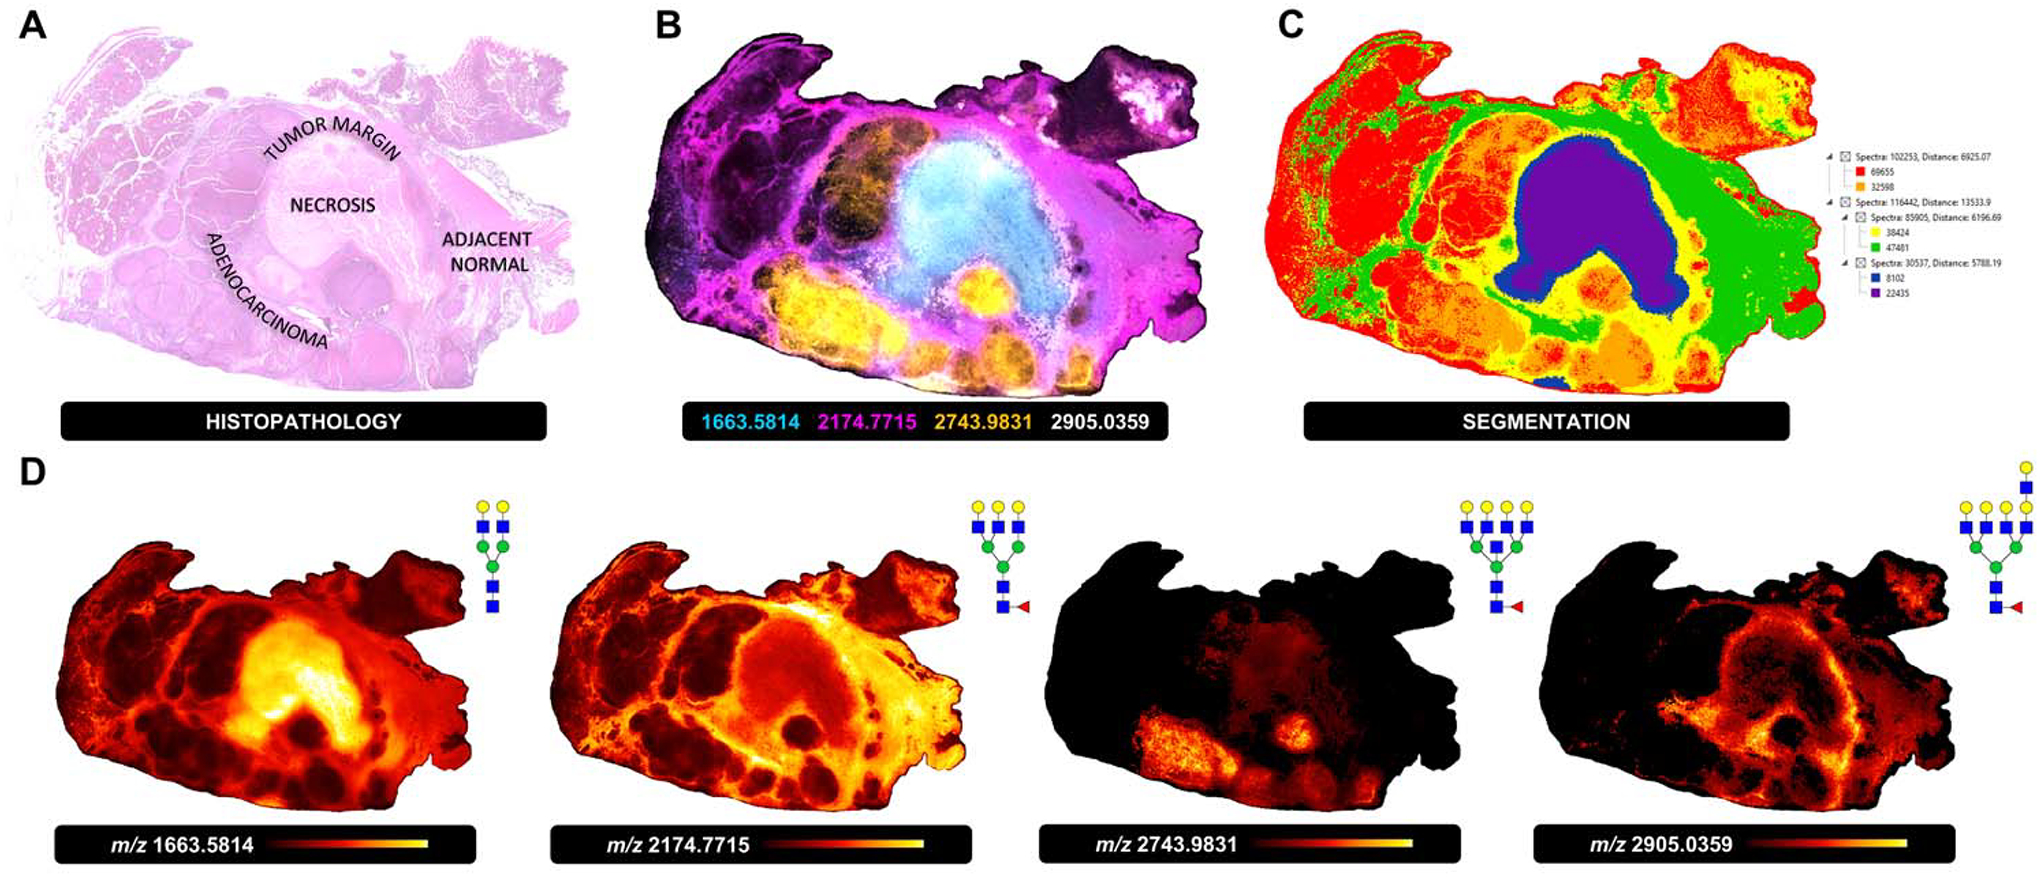
Figure 6. N-glycan imaging mass spectrometry of a late stage pancreatic ductal adenocarcinoma tissue.

A) H&E staining and histopathological annotation of a late stage PDAC tissue with adenocarcinoma, necrosis, tumor margin and adjacent normal subtypes. B) Overlay image of four representative N-glycan masses specific to each tissue subtype (adenocarcinoma, orange, Hex7dHex1HexNAc7, m/z 2743.9831; necrosis, cyan, Hex5HexNAc4, m/z 1663.5814; tumor margin, white, Hex8dHex1HexNAc7, m/z 2905.0359; adjacent normal, pink, Hex6dHex1HexNAc5, m/z 2174.7715). C) Segmentation analysis based on 85 unique N-glycans detected. D) Individual N-glycan heatmaps for tissue-subtype specific N-glycans m/z 1663.5814, m/z 2174.7715, m/z 2743.9831 and m/z 2905.0359.
