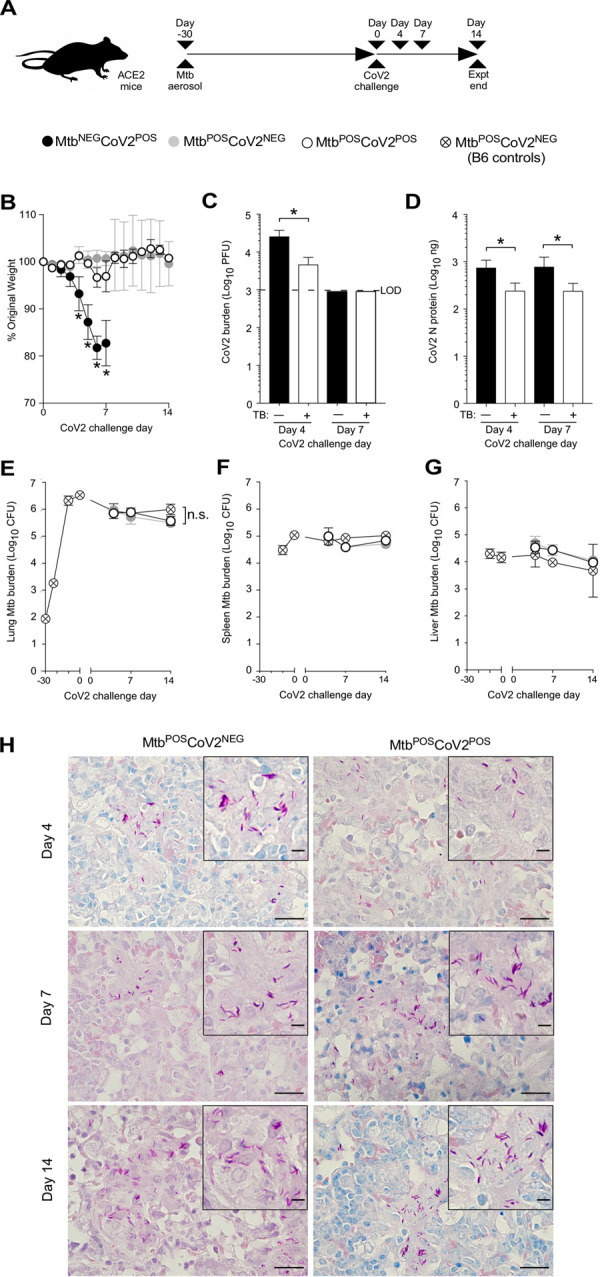
Fig 1. Mtb-infected ACE2 mice are resistant to secondary infection with CoV2.

(A) Experimental overview of our ACE2:CoV2 model studies, wherein mice were infected via aerosol with Mtb (Day -30) and challenged 30 days later (Day 0) with CoV2. On post-challenge Day 4, Day 7 and Day 14, tissues were collected for microbiological and immunological assessments. Experimental groups included ACE2 mice which were not infected with Mtb prior to CoV2 challenge (MtbNEGCoV2POS), ACE2 mice which were infected with Mtb but challenged with sterile saline (MtbPOSCoV2NEG), ACE2 mice which were infected with Mtb prior to CoV2 challenge (MtbPOSCoV2POS), and B6 controls which were infected with Mtb (to determine what if any impact human ACE2 transgene expression alone has on Mtb burdens). (B) The percent weight change experienced by each group of ACE2 mice following CoV2 challenge, as normalized to the original weight of each mouse. (C) CoV2 PFU burdens and (D) CoV2 N protein levels in the lungs of MtbNEGCoV2POS and MtbNEGCoV2POS mice. (E-G) Mtb CFU burdens in the (E) lungs, (F) spleen and (G) liver of MtbPOSCoV2NEG and MtbPOSCoV2POS mice, as well as B6 controls throughout the experiment time course. In each graph the following legend applies: MtbNEGCoV2POS, black circles or bars; MtbPOSCoV2NEG, gray circles; MtbPOSCoV2POS, white circles or bars. (H) Representative micrographs of AFB stained lung sections, as collected from MtbPOSCoV2NEG and MtbPOSCoV2POS mice at the indicated times post-challenge. In each micrograph, the large scale bar is 20 μM and inset scale bar is 5 μm. This experiment was repeated twice, each with similar results (4 mice/group/timepoint). *, p ≤ 0.05 as determined by either Student’s t-test or ANOVA; n.s., not significant.
