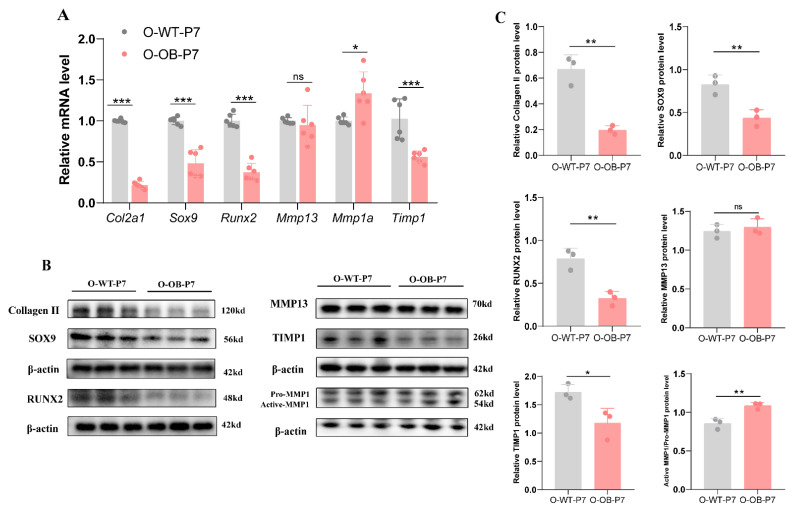
Figure 3.
Key indicators expression of knee cartilage in 7-day male mice offspring of control and obese groups. (A) Relative mRNA, (B) representative western blot bands, and (C) statistical results of knee cartilage 7-day male mice offspring in the control group versus obese group. O-WT-P7: offspring 7-day male mice from the control mothers. O-OB-P7: offspring 7-day male mice from the obese mothers. (A) n = 6 represents six mice in each group from at least three litters of different mothers. (B) n = 6, each band represents the expression of cartilage tissue proteins in two mice from at least three litters of different mothers. Results are expressed as mean ± SD. ns not significant, * p < 0.05, ** p < 0.01, and *** p < 0.001.

