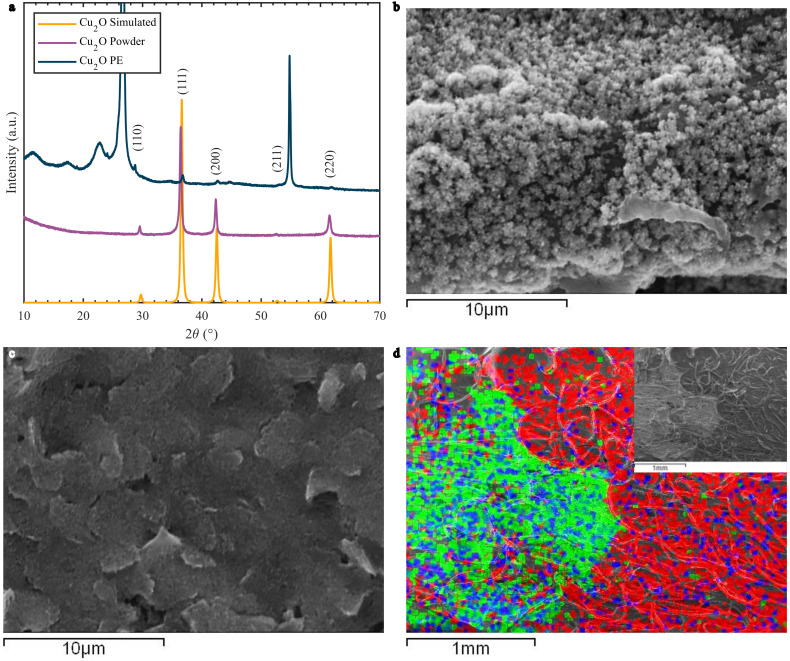
Figure 2.
(a) XRD spectrum of simulated Cu2O, synthesized powder Cu2O, and WE drop casted with Cu2O nanoclusters (Cu2O PE). (b) SEM images of the Cu2O drop casted on the PEs: (b) Cu2O nanoclusters, (c) graphene paste and (d) EDS mapping of the interface between Cu2O and the graphene paste with an inset of the SEM image. Green corresponds to Cu, blue to O, and red to C.

