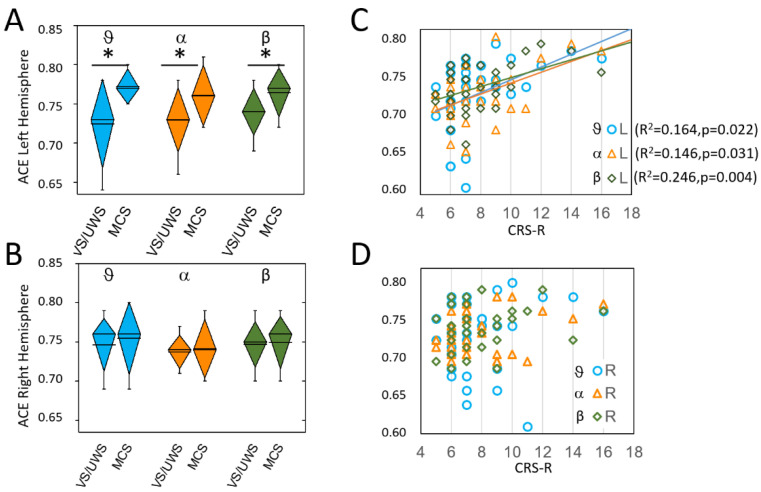
Figure 1.
ACE values on left (L) (A); and right (R) (B) hemispheres. Significant differences between MCS and VS/UWS were observed on the left hemisphere only and are marked with asterisks. In each diamond box, the line represents the mean value, the diamond height represents the SD and the whiskers represent the 10–90% range of the values. Panels C and D show, with the same colors as in A and B, the linear relationships between ACE measures and CRS-R score, which were significant on the left hemisphere only (the lines are shown only for significant relationships, with the same color of the symbols). The theta values are in light blue (circles in (C,D)), the alpha values in orange (triangles in (C,D)), and the beta values are in dark green (diamonds in (C,D)).

