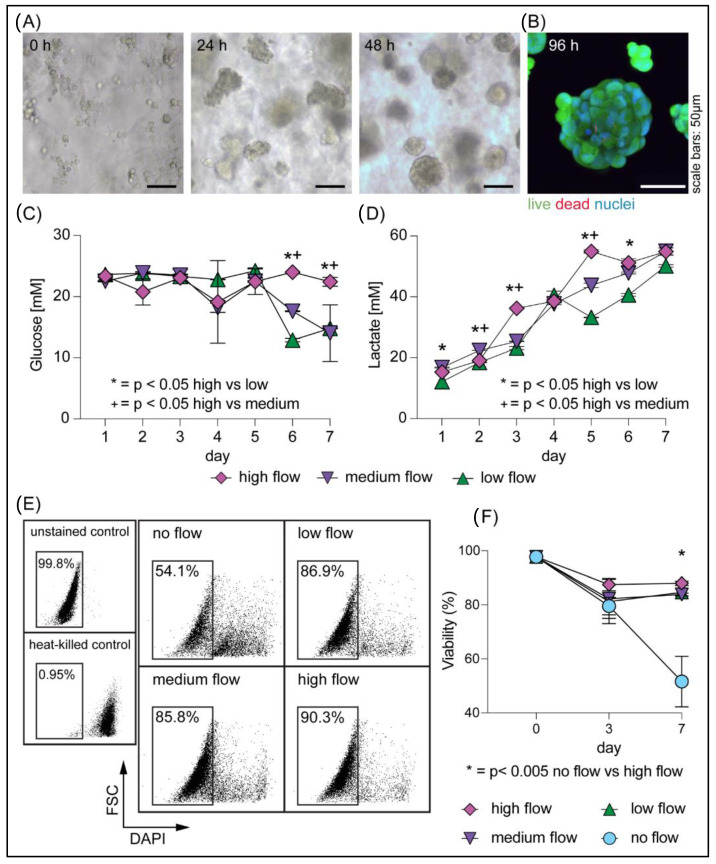
Figure 2.
Single-cell human cardiomyocytes cultured in 3D in LLS: (A) Phase contrast microscopy images of AC16 cells cultured in a 24-well Darcy plate at 0, 24, and 48 h showing cellular aggregation and spheroid formation. (B) Viability of AC16 spheroids on day 4 was assessed by fluorescent microscopy using Calcein AM (live) and BOBO-3 Iodide (dead). (C) Glucose consumption and (D) lactate secretion were measured from two technical replicates of daily effluent media collection, revealing metabolic activities of the AC16 cells. Statistical analysis was performed using two-way ANOVA with comparisons to the high flow condition to assess significance at each time point. (E,F) The percentage of cell viability was assessed by flow cytometry. (E) Characteristic flow profiles for all four conditions for one representative replicate on day 7 (typical for all samples, n = 3 replicates for each condition). The insets on the left show an example of a gating strategy used for assessing viability including the use of a heat-killed control. (F) Proportion of viable cells at day 0, day 3, and day 7 from different flow rates, 25.4 ± 4.1 (low), 35.3 ± 4.1 (medium), and 43.1 ± 4.8 µL/hr/well (high) for all samples, confirms significant viability of the cell populations in the presence of perfusion flow. Triplicate wells were used to measure viability in each condition, and two-way ANOVA with Dunnett’s post-test was used for statistical analysis.

