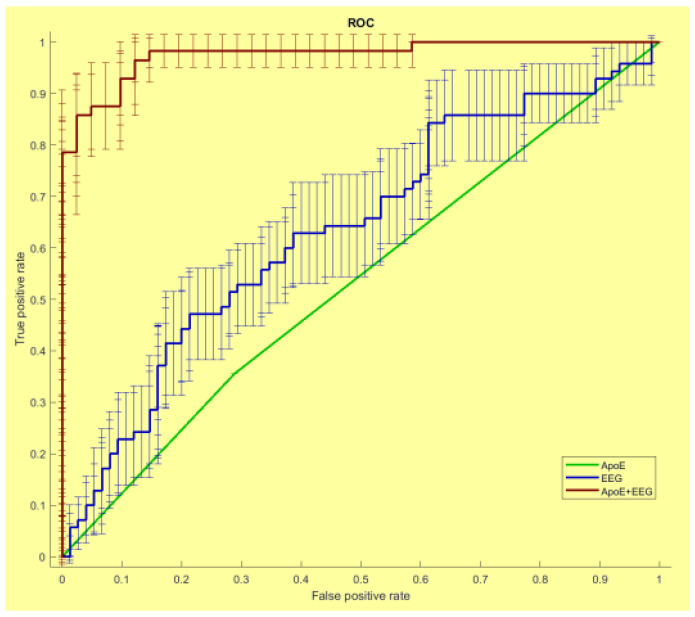
Figure 1.
The receiver operating characteristic (ROC) curves illustrating the classification of the Stable and Converted MCI individuals based on the Apo-E (red line), SW (green line) and Apo-E and SW (blue line) values. The area under the (ROC) curve (AUC) was, respectively, 0.52, 0.64 and 0.97. Adapted from [45].

