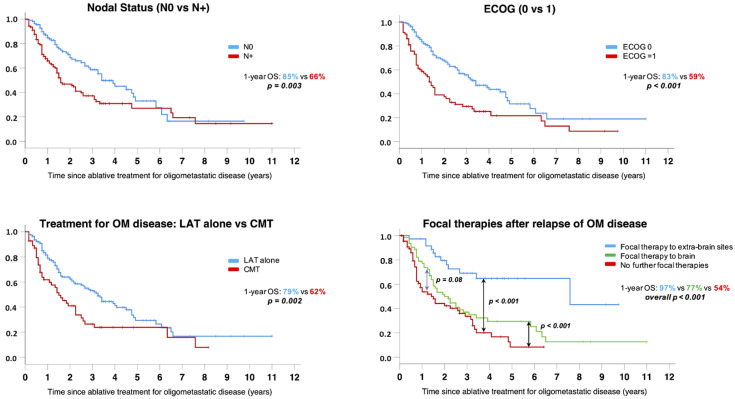
Figure 3.
Subgroup analysis showing OS Kaplan–Meier curves stratified for the following variables: Nodal involvement (upper left chart), ECOG PS (upper right chart), addition of chemotherapy (CMT) to LAT (lower left chart) and the delivery of any further local treatment for relapse/progression after LAT (lower right chart).

