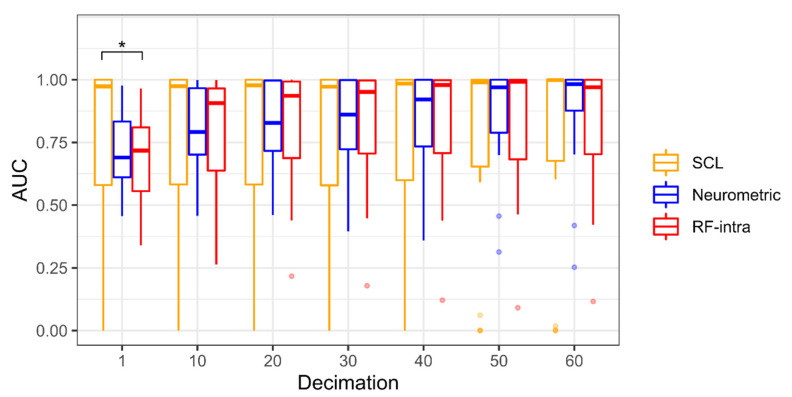
Figure 4.
Boxplot representation of Area Under Curve (AUC) for seven different decimations (1 to 60 by 10 s step) of the multitasking experiment. The Random Forest (RF-intra) is represented in red, the Neurometric in blue, and the Skin Conductance Level (SCL) in orange. The points represent the outliers, and the asterisk shows that p < 0.05 resulting from the Dunn’s post-hoc tests.

