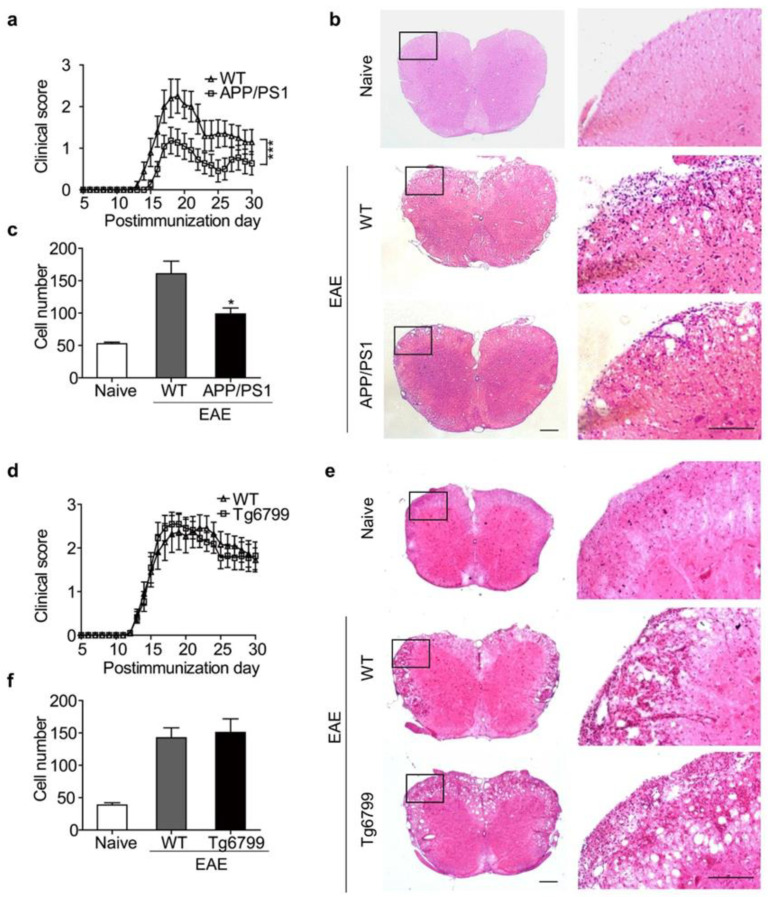
Figure 1.
Clinical symptoms of EAE in APP/PS1 and Tg6799 transgenic mice. (a) Clinical scores of EAE in WT and APP/PS1 mice. Results are presented as daily mean clinical scores ± SEM. *** p < 0.001, two-way ANOVA (WT, n = 10; APP/PS1, n = 11). (b) Hematoxylin and eosin (H&E)-stained slides of spinal cords from naive, WT, and APP/PS1. (c) Quantification of infiltrating cells. Data are mean ± SEM, * p < 0.05 (Student’s t-test). (d) Clinical scores of EAE in WT and Tg6799 mice (n = 11 per group). (e,f) H&E staining was performed to analyze infiltrating cells. The boxed areas in the left columns are presented enlarged on the right. Scale bars, 200 μm.

