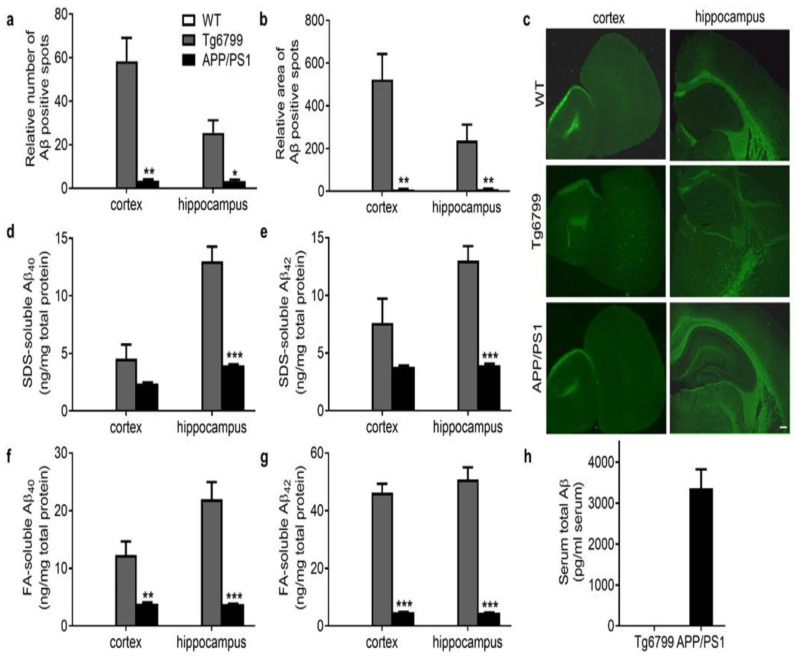
Figure 2.
Serum and brain Aβ levels in Tg6799 and APP/PS1 transgenic mice. (a,b) The relative number and area of Aβ plaques in cortex and hippocampus of WT, Tg6799, and APP/PS1 mice were quantified. (c) Representative images of senile plaques with thioflavin-S staining in cortex and hippocampus sections. (d–g) Brain Aβ levels, including (d,e) SDS-soluble Aβ42 and Aβ40 and (f,g) FA-soluble Aβ42 and Aβ40 in the cortex and hippocampus of WT, Tg6799, and APP/PS1 mice by ELISA. n = 3–5. Data are mean ± SEM, *** p < 0.001, ** p < 0.01, * p < 0.05 (Student’s t-test). (h) Serum Aβ levels in Tg6799 and APP/PS1 transgenic mice were measured by using the human total Aβ ELISA kits. n = 6. Scale bars, 200 μm.

