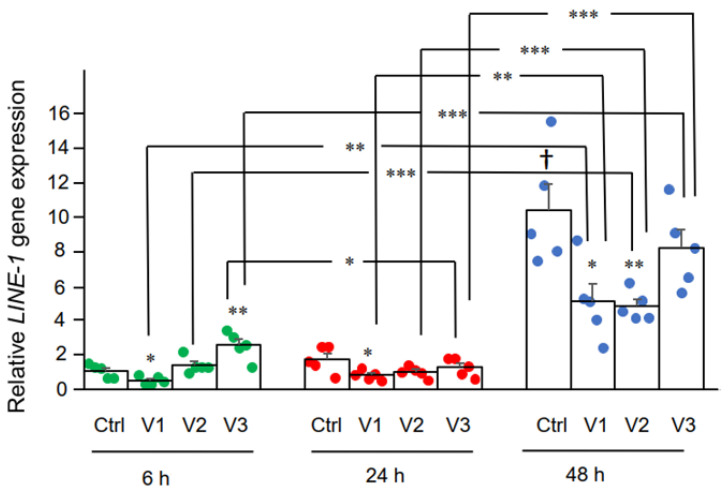
Figure 3.
LINE-1 mRNA levels in Huh7 cells treated with BNT162b2. Huh7 cells were treated without (Ctrl) or with 0.5 (V1), 1 (V2), and 2 µg/mL (V3) of BNT162b2 for 6 (green dots), 24 (red dots), and 48 h (blue dots). RNA was purified and qPCR was performed using primers targeting LINE-1. RNA levels of LINE-1 are presented as 2−ΔΔCT values relative to house-keeping genes GAPDH and ACTB. Results are from five independent experiments (n = 5). Differences between respective groups were analyzed using two-tailed Student’s t-test. Data are expressed as the mean ± SEM. (* p < 0.05; ** p < 0.01; *** p < 0.001 vs. respective control at each time point, or as indicated; † p < 0.05 vs. 6 h-Ctrl).

