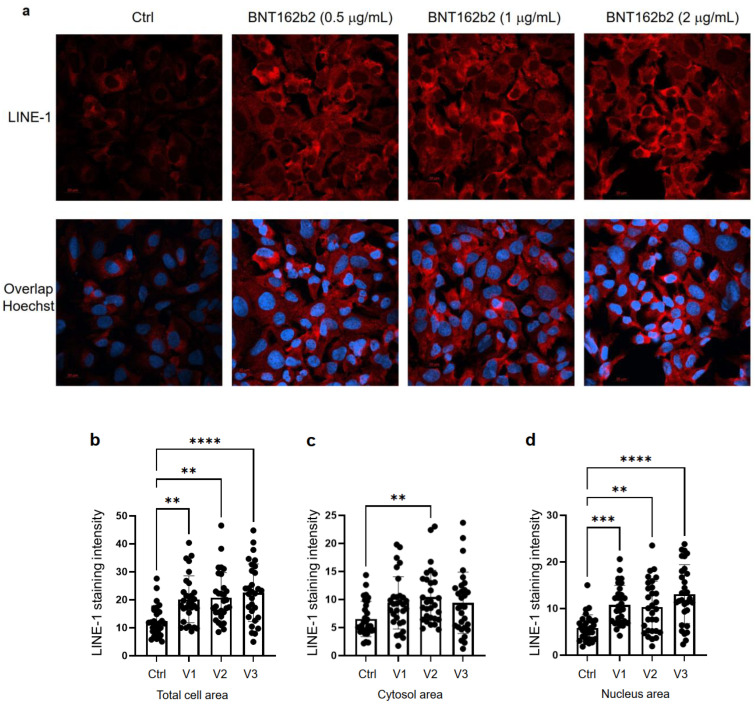
Figure 4.
Immunohistochemistry of Huh7 cells treated with BNT162b2 on LINE-1 protein distribution. Huh7 cells were treated without (Ctrl) or with 0.5, 1, and 2 µg/mL of BNT162b2 for 6 h. Cells were fixed and stained with antibodies binding to LINE-1 ORF1p (red) and DNA-specific probe Hoechst for visualization of cell nucleus (blue). (a) Representative images of LINE-1 expression in Huh7 cells treated with or without BNT162b2. (b–d) Quantification of LINE-1 protein in whole cell area (b), cytosol (c), and nucleus (d). All data were analyzed using One-Way ANOVA, and graphs were created using GraphPad Prism V 9.2. All data is presented as mean ± SD (** p < 0.01; *** p < 0.001; **** p < 0.0001 as indicated).

