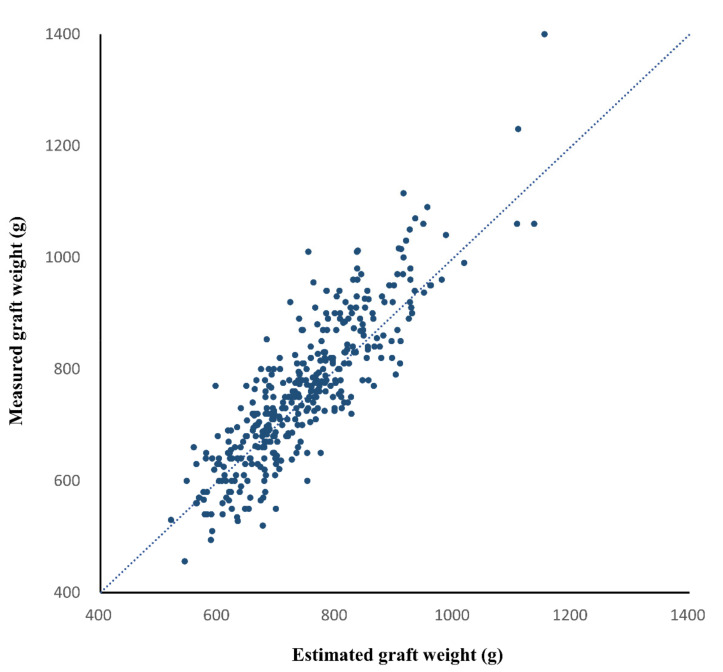
Figure 4.
Scatter plot of the estimated and measured graft weights in the validation group. The dashed line is the reference line indicating complete agreement. The concordance correlation coefficient between the estimated and measured graft weights was 0.834 (95% confidence interval, 0.804 to 0.860, p < 0.001).

