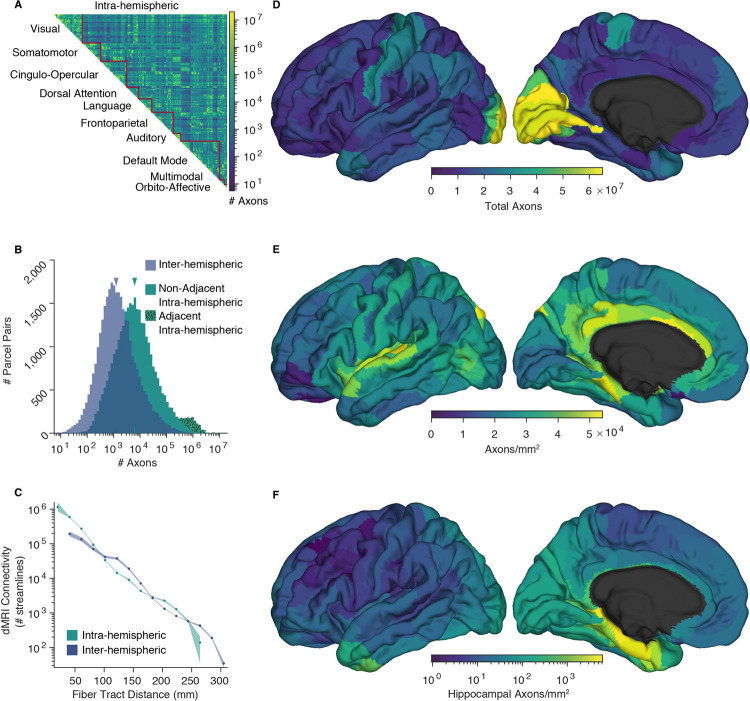
Fig 1. The number of axons estimated to interconnect the 360 cortical parcels of the HCP-MMP1.0 atlas.
(A) Connectivity matrix of intrahemispheric axon counts, averaged across the 2 hemispheres. Parcels are ordered into 10 functional networks. (B) Histograms showing the distribution of inter- and intrahemispheric pairwise axon counts. Physically adjacent and nonadjacent parcel pair intrahemispheric histograms are stacked. Median connectivity, indicated, is approximately 6,200 axons between cortical areas in the same hemisphere and approximately 1,300 interhemispherically. (C) Comparison of intra- and interhemispheric dMRI connectivity as a function fiber tract distance. Pairwise values averaged within 15 fiber length bins. Shading shows bootstrapped 95% confidence intervals. (D–F) Axon counts and densities averaged across the 2 hemispheres and visualized on the left fsaverage template cortex [12]. (D) Total axons connecting each parcel to all others. (E) Axons connecting each parcel to all others, normalized by the reference parcel’s area. (F) Axons connecting the hippocampus to the rest of the cortex, normalized by the area of the cortical parcel, shown in log scale. HCP, Human Connectome Project. The source data for this figure can be found at https://doi.org/10.5281/zenodo.6097026.

