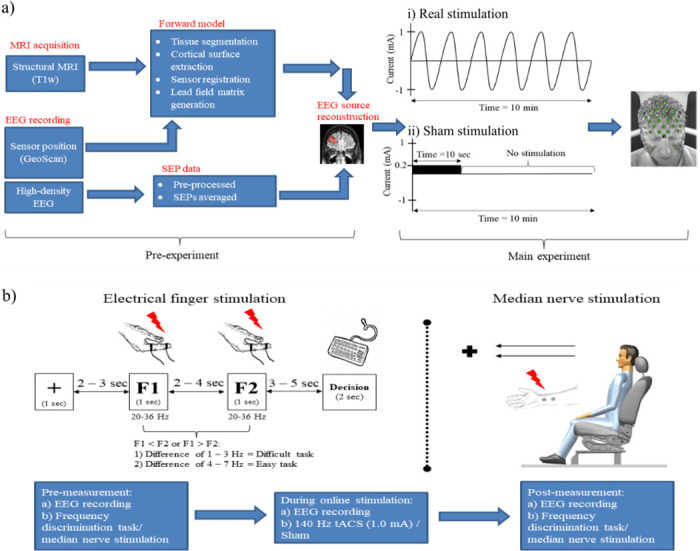
Fig 1. Experimental design.

(a) This study consisted of two phases of measurements. In the pre-experiment, the stimulation target was determined from two separate sessions of MRI data acquisition and EEG recording. Both anatomical (MRI) and functional (EEG) data were subjected to the source reconstruction to obtain the information on the P20/N20 source dipole. (b) In the main experiment, both real and sham transcranial stimulation were carried out for 10 minutes on separate days using an individualized stimulation electrode montage which was calculated in (a). Measurements of the main experiment involved either the electrical finger stimulation or the median nerve stimulation in separate sessions. The order of the sessions was randomized with at least five days between each session. In the sessions with electrical finger stimulation, participants performed the frequency discrimination tasks. They were requested to discriminate which out of two frequencies was faster (F1 or F2). There were 70 trials in each task, and the order of the frequency differences was pseudo-randomized. Out read performance was grouped as an easy task if the frequency difference was 4–7 Hz, whereas a difficult task was scaled with 1–3 Hz difference. Each session started with pre-measurement, followed by 10 minutes of transcranial electrical stimulation and the post-measurement. Abbreviations: MRI = magnetic resonance imaging; EEG = electroencephalography; SEP = somatosensory evoked potential; tACS = transcranial alternating current stimulation; F1 = frequency 1; F2 = frequency 2.
