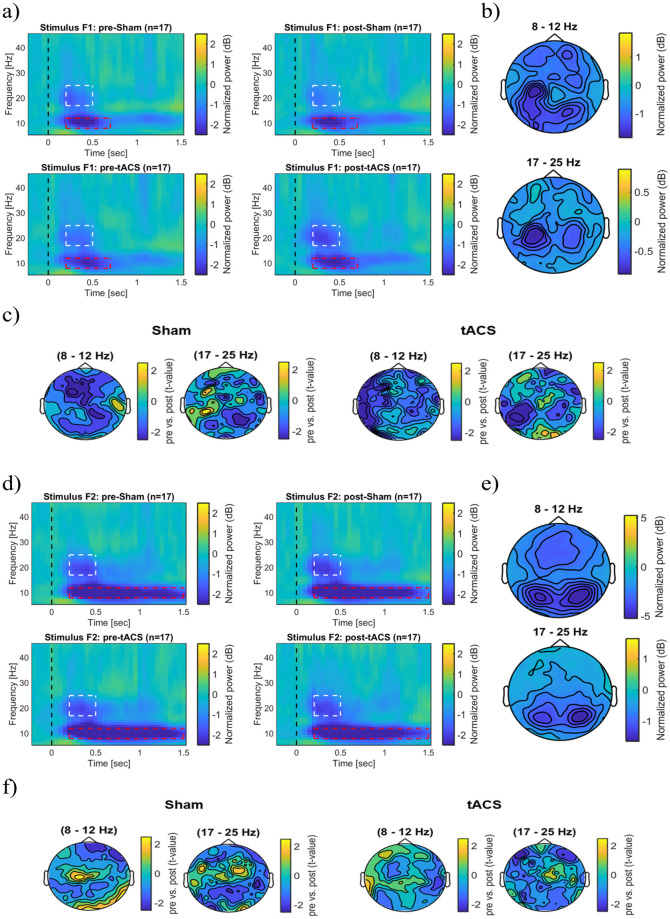
Fig 6. Modulatory effects of tACS on induced power during and immediately after discrimination tasks.
(a) Overview of the average induced oscillatory power during and immediately after F1 stimulus presentation both before and after stimulation with Sham and tACS. Power changes were derived from the stimulation electrodes above the somatosensory cortex. (b) The figure shows the scalp topography of average induced power changes during stimulus F1. (c) Induced power differences before and after stimulation with Sham and tACS in both frequency bands during stimulus F1 (Cluster-based permutation test, p > 0.05). (d) Overview of the average induced oscillatory power during and immediately after presentation of the F2 stimulus for Sham and tACS conditions. The representations showed the average power changes on the stimulation electrodes. (e) Scalp topography demonstrates the average induced power changes during stimulus F2 at the respective frequencies. (f) Induced power differences before and after stimulation with Sham and tACS during F2 stimulus presentation in both frequency bands (Cluster-based permutation test, p > 0.05). The dashed rectangle highlights the time-frequency window of 8–12 Hz and 17–25 Hz frequency bands.

