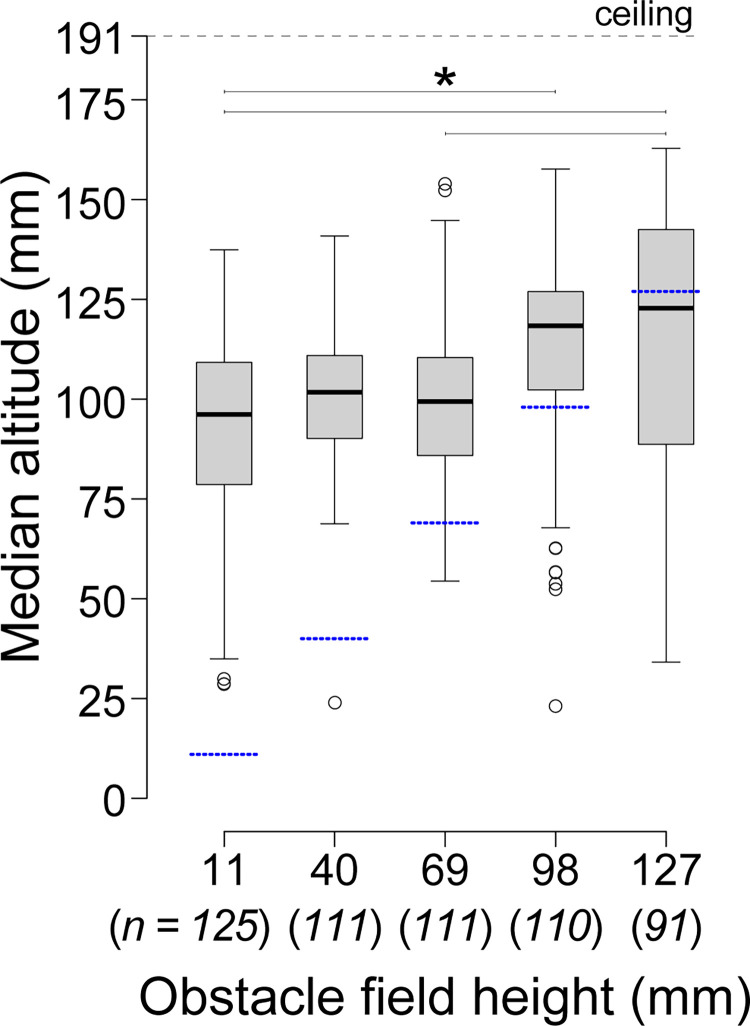
Fig 2. Median altitude of bees transiting obstacle fields.
Dashed blue lines in indicate the obstacle field height relative to the flight altitude. Lines with asterisks indicate statistically different groups based on a linear mixed-effect model with Tukey post hoc comparisons (* P < 0.05). Italicized numbers below the x-axis labels show the sample size (number of flights) for each obstacle field height.

