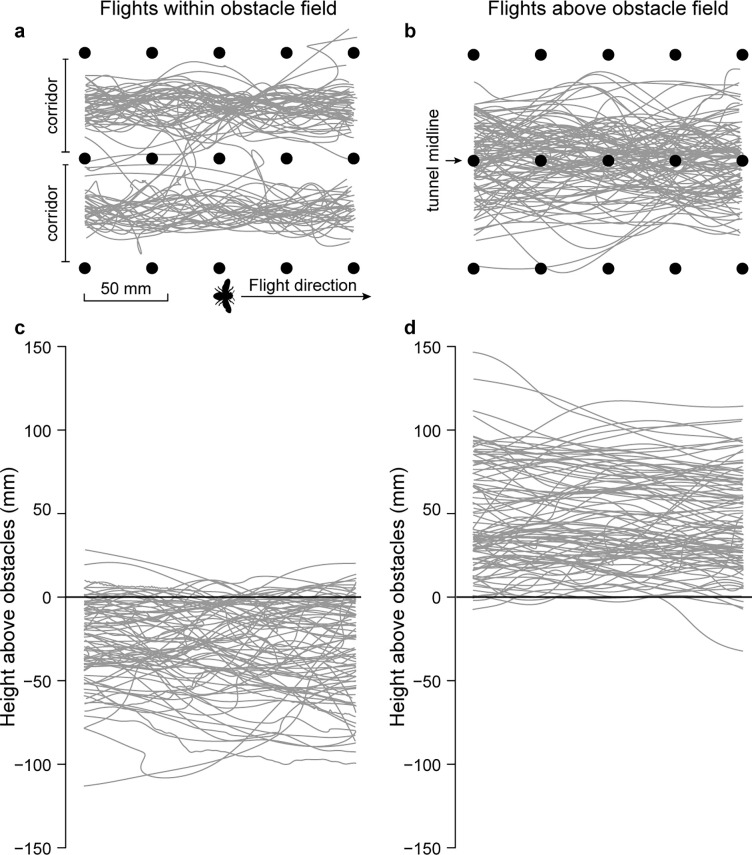
Fig 3.
Digitized flight trajectories for bees flying within (a, c) and above (b, d) the obstacle field. Panels (a) and (b) show trajectories from a top-view, illustrating the longitudinal and lateral extent of the flight paths. Panels (c) and (d) show trajectories from a side-view, illustrating the longitudinal and vertical extent (relative to the top of the obstacle field) of the flight paths. All 82 flights within the obstacle field are shown, but for clarity, traces of only 100 of the 466 flights above the obstacle field are shown.

