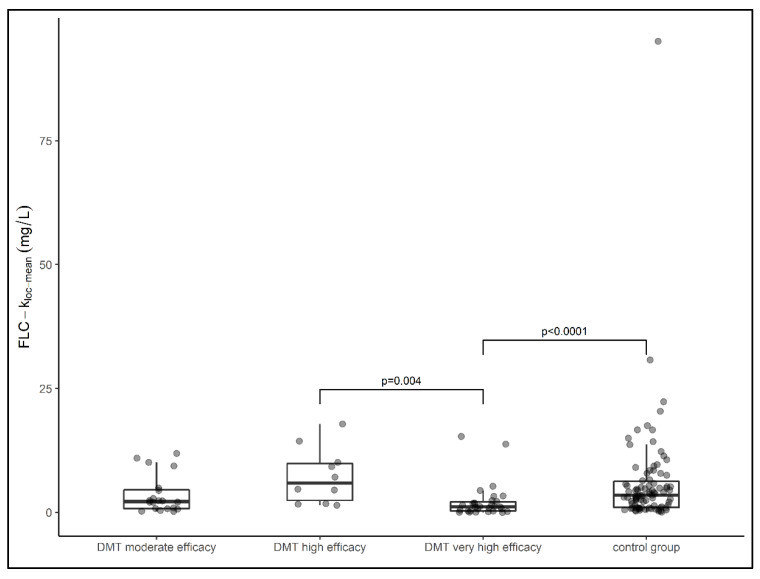
Figure 2.
Data of local FLCκ concentrations of patient samples presented in box plots (median, first, and third quartile). Samples from patients treated with very high effective DMT had significantly lower FLCκ concentrations than samples treated with high effective DMT (p = 0.004) and the control group (p < 0.0001). DMT—disease-modifying therapy, FLCκ—free light chains kappa. Comparison between groups was performed using the Kruskal–Wallis test. The Dunn–Bonferroni test was used for post hoc analysis.

