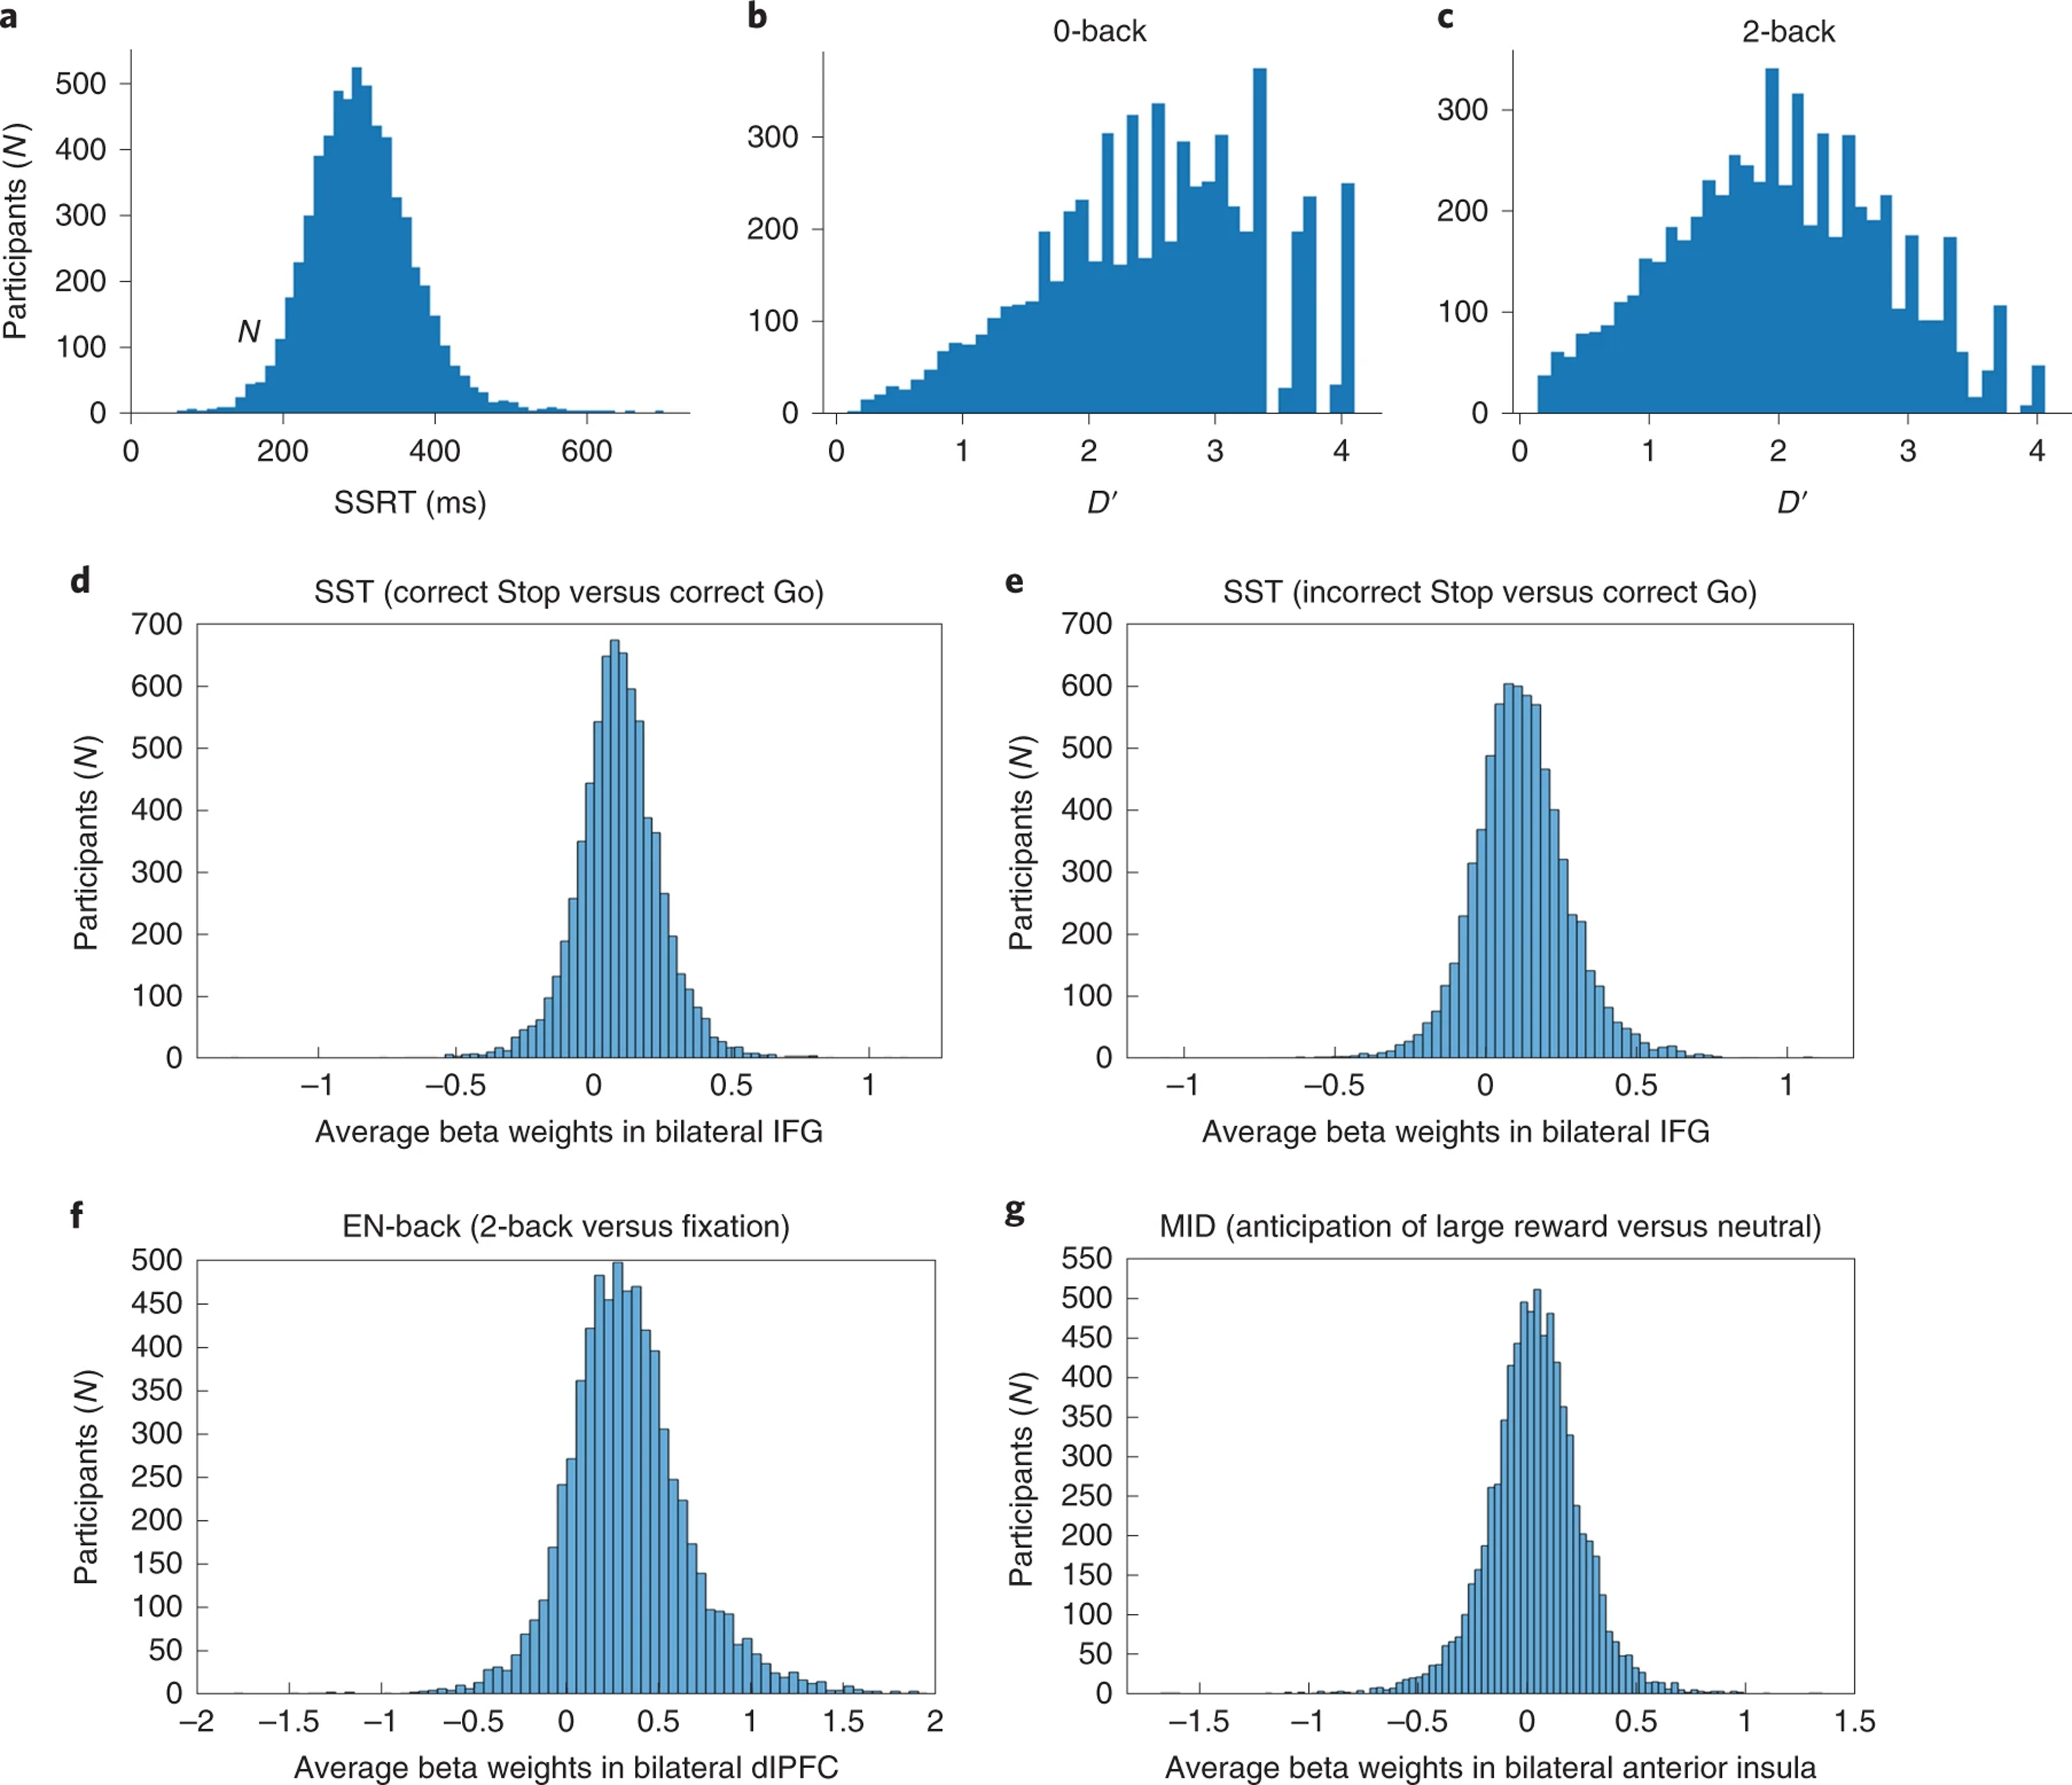
Figure 2.

The distribution of behavioral performance measures and beta weights in the sample. Top quadrants: The distribution of Stop Signal Reaction Time (SSRT) (a) and 0-back and 2-back and D-prime (b,c) behavioral performance measures in the sample. Bottom quadrants: The distribution of average local maxima beta weights in the sample within task-specific regions commonly known to be involved in SST (d,e), EN-back (f) and MID (g) tasks. Sample Sizes: SST (N=5,547), EN-back (N=6,009), and MID (N=6,657).
