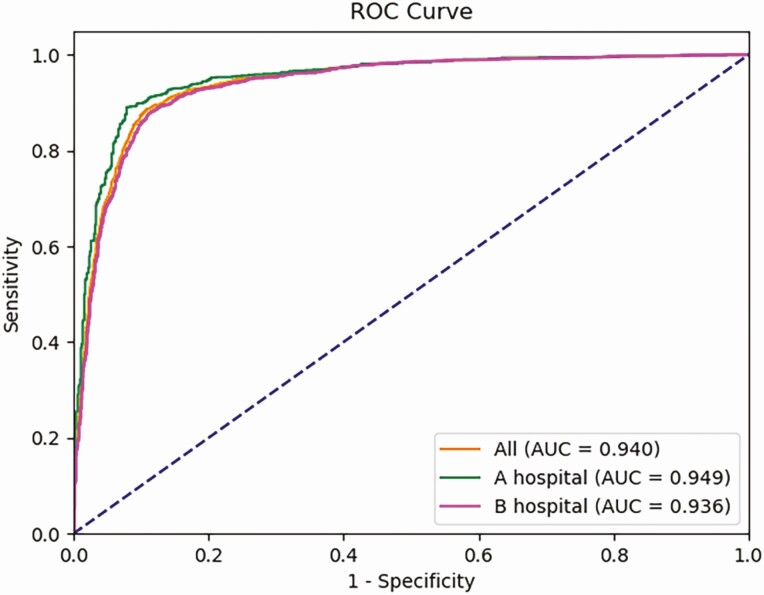
Figure 2.
Receiver operating characteristic (ROC) curves of the HT-CAD model on different hospitals. Orange line shows the performance of HT-CAD model on all validated Hashimoto’s thyroiditis (HT) images, including images from Hospitals A and Hospital B; the area under the curve (AUC) is 0.940. Green line indicates the performance of HT-CAD model on HT images from A hospital, and the AUC is 0.949. Purple line indicates the performance of HT-CAD model on HT images from B hospital, and the AUC is 0.936. There is no statistical difference (P > 0.05).

