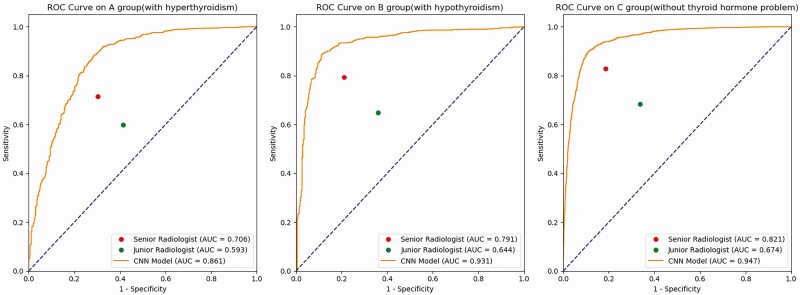
Figure 3.
Receiver operating characteristic (ROC) curves of the HT-CAD model on different thyroid hormone levels. (A) The ROC curve of the HT-CAD model in the hyperthyroidism subgroup. (B) The ROC curve of the HT-CAD model in the hypothyroidism subgroup. (C) The ROC curve of the HT-CAD model in the euthyroidism subgroup. The red dots indicate the diagnostic sensitivities and specificities of senior radiologists. The green dots indicate the diagnostic sensitivities and specificities of junior radiologists. Compared to the senior and junior radiologists, the HT-CAD model showed the better diagnostic performance in the hyperthyroidism, hypothyroidism, and euthyroidism subgroups.

