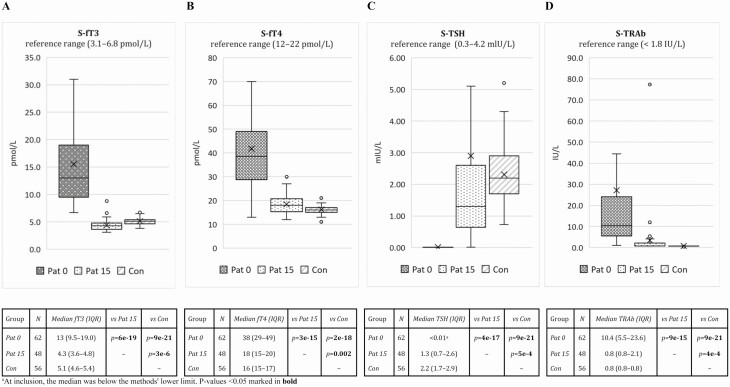
Figure 1.
Laboratory measurements and reference values of A, serum free triiodothyronine (S-fT3); B, serum free thyroxine (S-fT4); C, serum thyrotropin (S-TSH); and D, serum TSH receptor antibody (S-TRAb) in premenopausal women with newly diagnosed Graves disease at inclusion (Pat 0; N = 62) and at follow-up (Pat 15; N = 48), and matched controls (Con; N = 56). For the box-whisker plots, the horizontal line within the box is the median, X is the mean, the horizontal ends of the boxes are the lower and upper quartiles, and the whiskers are nonoutlier minimum and maximum. Numbers of participants (N) and levels of significance for group comparisons (Mann-Whitney U test) are specified in the table below. IQR, interquartile range; Pat, patient. P values less than .05 are shown in bold.

