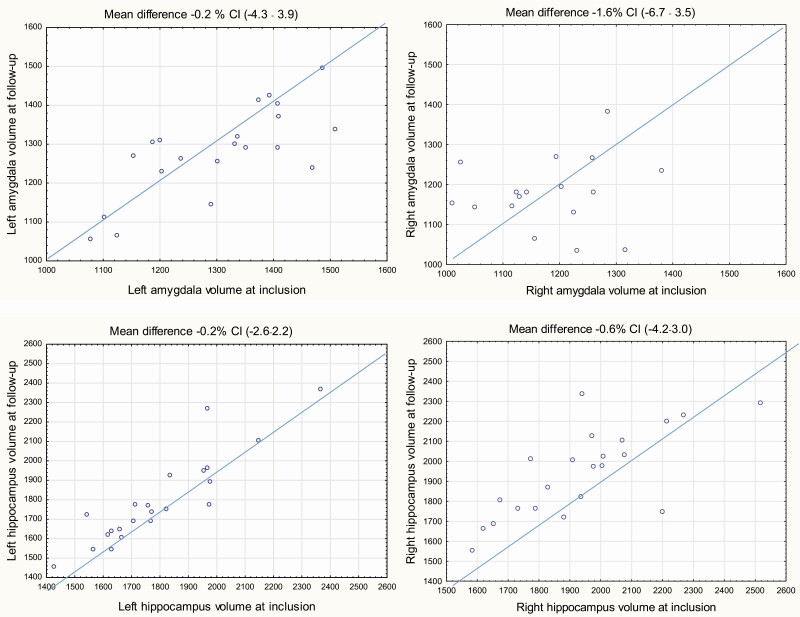
Figure 3.
Scatterplots of the left and right non-intracranial volume (ICV)-normalized volumes of amygdalae and hippocampi in 22 controls at inclusion and at follow-up. Segmentation was performed with the MAPER (multiatlas propagation with enhanced registration) automatic method. Differences were calculated as the inclusion value minus the value at follow-up. At the top the mean difference (in %) is presented followed by a 95% CI from a one-sample t test of the mean difference where the reference value was set to 0.

