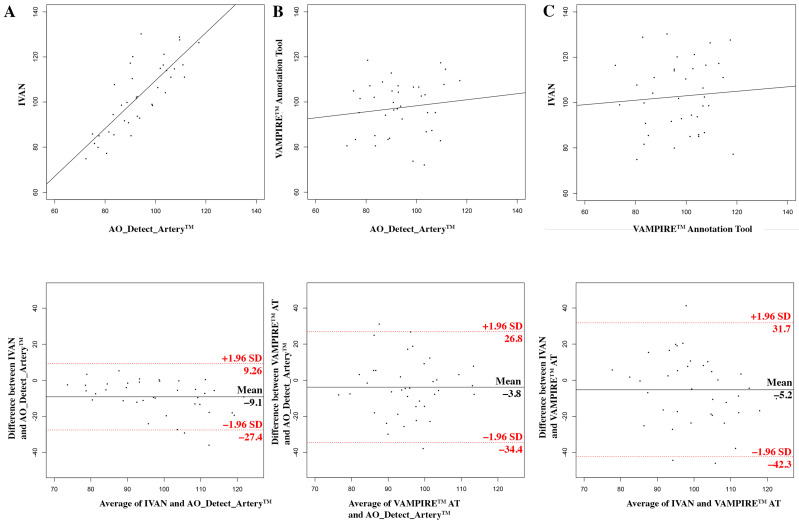
Figure 3.
Measurements of retinal artery lumens using AO and fundus camera images. Top row: scatter plots of vessel diameter measurements with the result of the Pearson correlation tests. Bottom row: Bland–Altman plots (see axis labels for measures, where compared). The top and bottom lines visualize the 95% limits of agreement (2SD) (A) using the AO_Detect_Artery™ software on AO image vs. IVAN software on fundus image; (B) using the AO_Detect_Artery™ software on AO image vs. VAMPIRE AT (annotation tool) on fundus image; (C) using IVAN software vs. VAMPIRE AT on fundus image.

