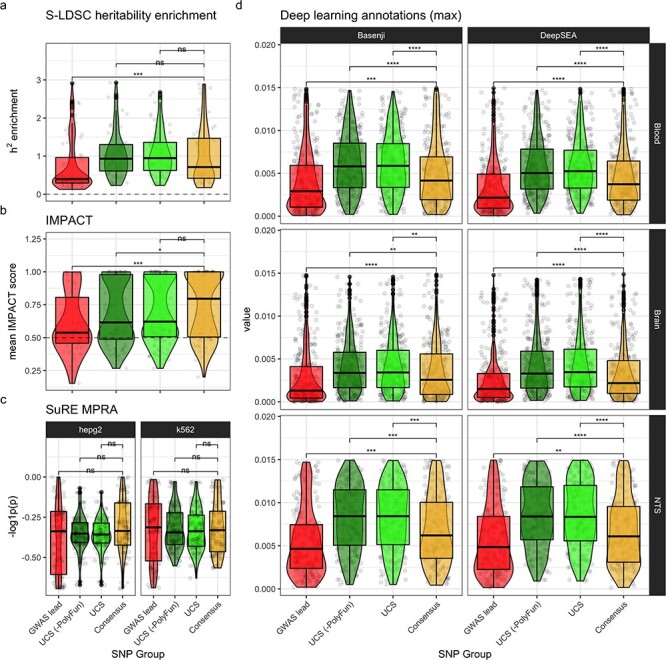
Figure 5.

Functional enrichment. Functional enrichment validation was performed by statistically comparing each SNP group. For each validation (panel), per-locus mean values were computed for each SNP group (each represented by a point). Significance labels are from Holm-adjusted P-values of pairwise Wilcoxon rank-sum tests. Significance key: ns: P > 0.05, *: P ≤ 0.05, **: P ≤ 0.01, ***: P ≤ 0.001, ****: P ≤ 0.0001. (a) Mean PolyFun-implemented (20) S-LDSC (44–46) heritability (h2) enrichment per locus per SNP group. (b) For each locus, the annotation with the highest mean IMPACT score across all SNPs in that locus was selected (to reduce noise from less relevant annotations). (c) SuRE MPRA results. Negative log10-transformed mean P-values from Wilcoxon rank-sum tests comparing gene expression changes between reference and alternative allele genotypes. Cell lines (i.e. HepG2 and K562) are separated into columns. (d) Deep learning model predictions of the epigenomic impact that mutating each genomic position would have. Tissue-specific models (i.e. Blood and Brain) were trained on datasets from only that tissue. Non-tissue-specific (NTS) models were also trained using all tissues together. For the purposes of readability, we collapse values across assays and remove outliers above the 75% percentile (see Supplementary Material, Fig. S4 for full view).
