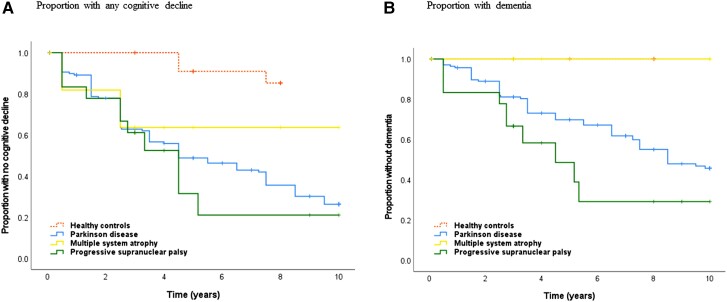
Figure 1.
Kaplan–Meier graphs showing the incidence of cognitive decline and dementia. Time is measured in years from first visit (baseline). No participant had dementia at baseline. The Kaplan–Meier graphs show incident (A) cognitive decline (MCI or dementia) and (B) dementia within 10 years. There were significant between-groups differences for (A) cognitive decline (P < 0.001, log rank) and (B) dementia within 10 years (P < 0.001, log rank). For specific group comparisons, see the ‘Results’ section.

