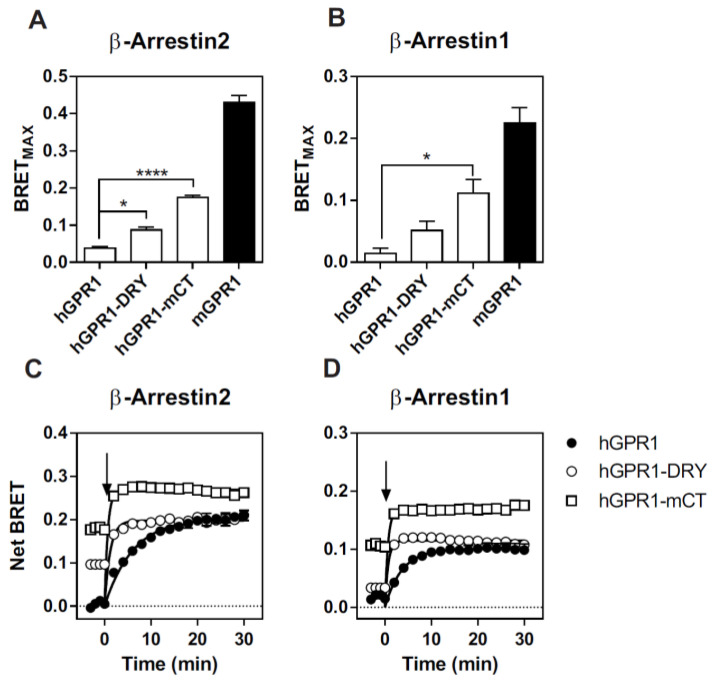
Figure 8.
R3.50 and the C-terminus of mGPR1 are involved in its interaction with β-arrestins. (A,B) BRETMAX values derived from BRET titration curves obtained with HEK293T cells transfected with a constant amount of β-arrestin2-RLuc (A) or β-arrestin1-RLuc (B) and increasing amounts of hGPR1-Venus, hGPR1-DRY-Venus, hGPR1-mCT or mGPR1-Venus. (C,D) Real-time measurement of BRET signal in HEK293T cells expressing β-arrestin2-RLuc (C) or β-arrestin1-RLuc (D) in combination with hGPR1-Venus (○), hGPR1-DRY-Venus (■) or hGPR1-mCT-Venus (□), in basal conditions and after stimulation with 100 nM chemerin. Results are expressed as Net BRET corresponding to the BRET signal measured between the donor and the acceptor minus the BRET signal measured with the donor only. Data represent the mean ± SEM of at least three independent experiments. * p < 0.05; **** p < 0.0001.

