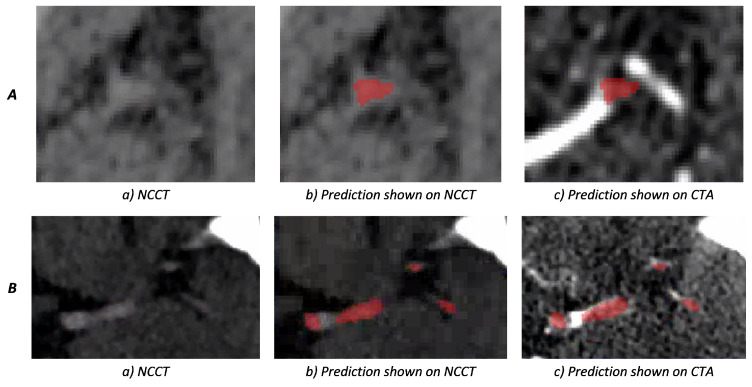
Figure 7.
Weighted-sum thrombus segmentation results for two patients. The segmentation prediction is depicted in red; (A) shows a difficult case in which the network is able to successfully segment a small thrombus where the hyperdense artery sign is not easily distinguishable from the background; (B) depicts a case where CTA shows that the thrombus is only partially present in the artery. Part of the non-occluded artery also shows as a hyperdense region on NCCT. Therefore, information from both NCCT and CTA is required to accurately annotate the thrombus. This figure shows that the network is able to discard the area with the visible contrast on CTA from the segmentation.

