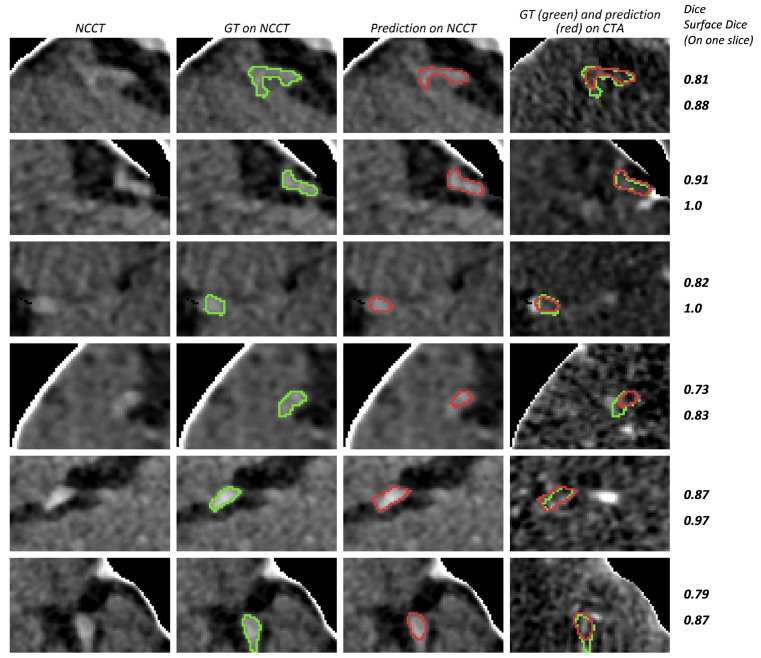
Figure 9.
Examples of cases with a Dice score higher than 0.6. The bounding box is used to limit the scan area for each case. Since the bounding box is three-dimensional, only the axial slice with the largest ground truth surface area is depicted. Different cases are represented in rows. The first three columns show NCCT and the right most image column shows the CTA image. The boundaries of the ground truth annotation (GT) and segmentation prediction (prediction) are shown in green and red, respectively. Dice and surface Dice values for the displayed 2D slice are shown at the right side for each row.

