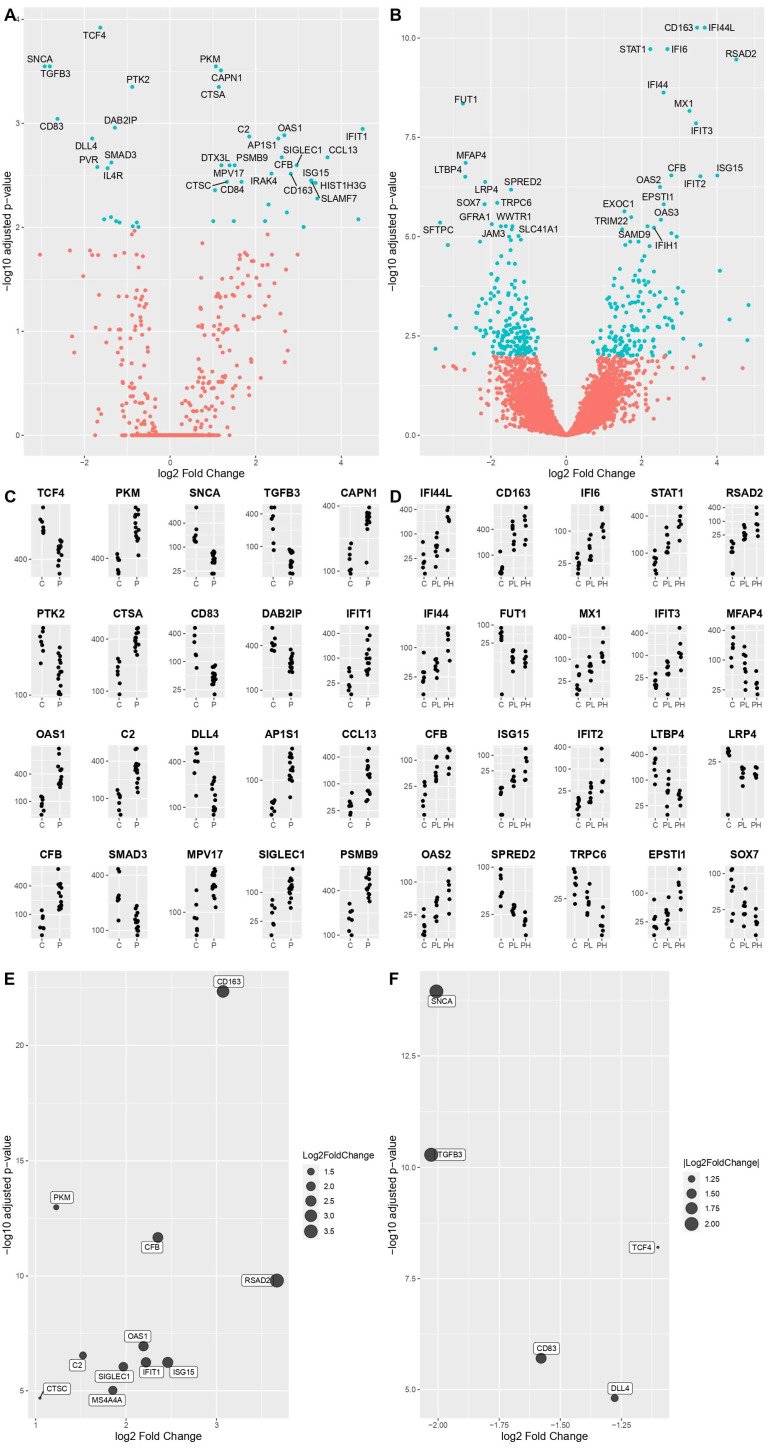
Figure 2.
The volcano plots depict the DEGs in virus-vs.-control design according to nCounter (A) and RNA-Seq (B) analyses. Specifically, on the right part of the plot COVID-19 significantly overexpressed genes are highlighted in terms of statistical relevance, on the left the downregulated ones. Extreme positions on the x-axis mean higher log2 fold change. Panels (C,D) are showing the relative expression of the top 20 most deregulated genes, in the same design, in the nCounter and RNA-Seq methodologies, respectively (C = control, P = patient with virus in low and high load). Extended analysis of the commonly deregulated genes in the two methodologies is shown in panel (E) (most expressed) and (F) (least expressed), with the largest dots representing increasingly higher values of log2 fold change.

