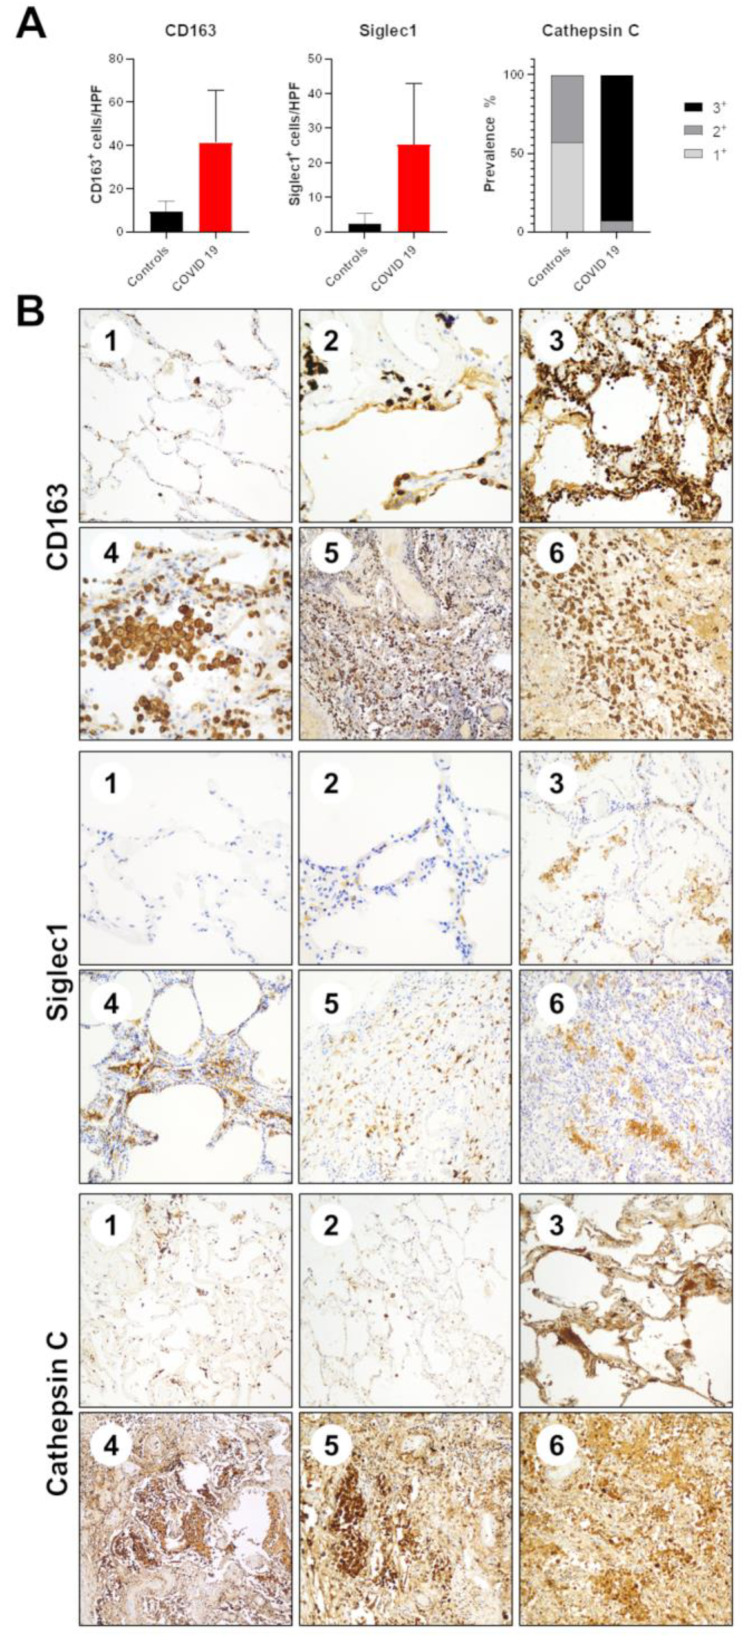
Figure 5.
Immunohistochemical validation of gene expression profiling data. (A) Boxplots of the expression of CD163, Siglec-1 and Cathepsin C by means of IHC in samples and controls. (B) Representative IHC staining of CD163, Siglec-1 and Cathepsin C in control (1 and 2) and COVID-19 derived (3–6) samples.

