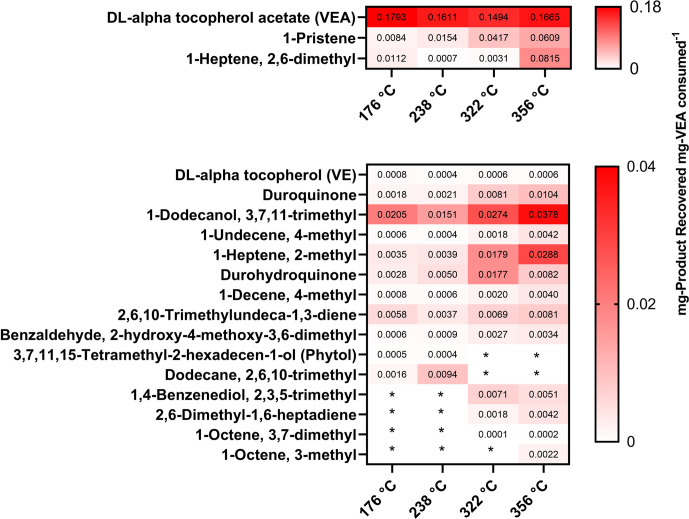
Fig 4. Heatmap of VEA vaping emission product distribution at 176, 237, 322, and 356°C.
Compounds were identified via NIST mass spectral library and included based on frequency and consistency of detection throughout all collections. Asterix indicates that the concentration of a product was below the detection limit of the instrument.

