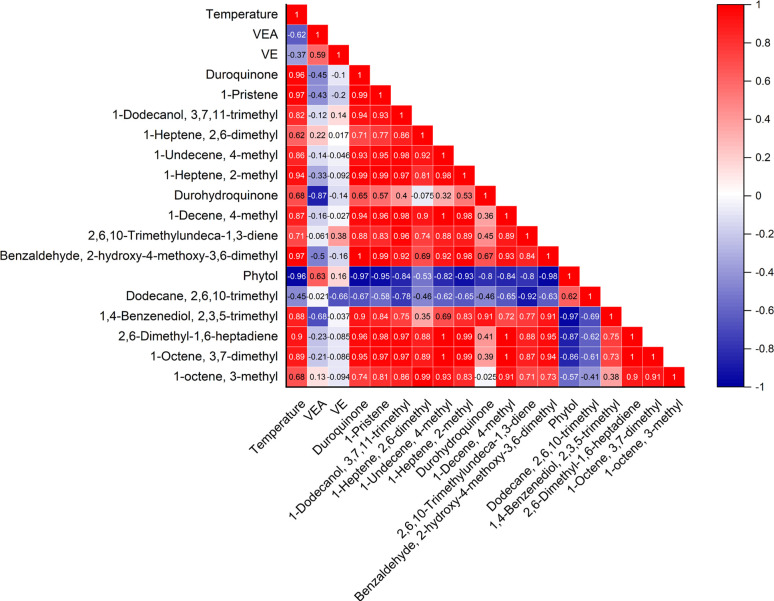
Fig 5. Correlation matrix for production VEA degradation products and temperature.
Pearson correlation analysis results depicting interactions between temperature and VEA degradation, and interactions between concentrations of degradation products. Positive correlations (R > 0) are depicted in red, while strong negative correlations (R < 0) are depicted in blue.

