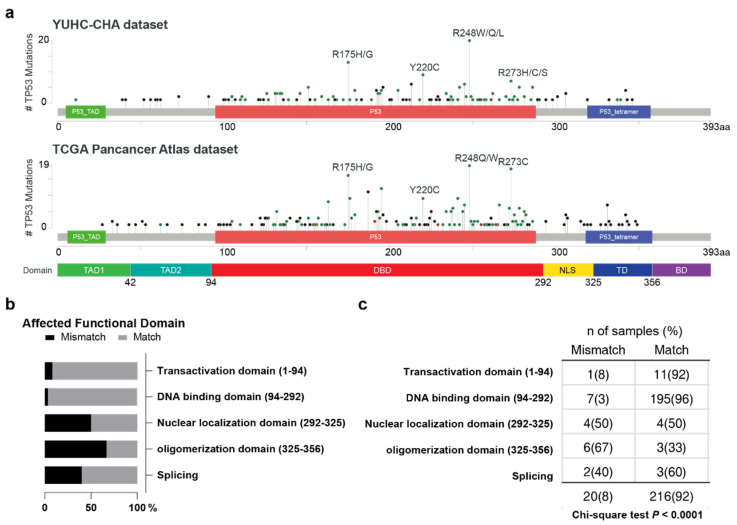
Figure 3.
(a) Lollipop plot of TP53 mutation frequencies by their domain site reported in this study and the TCGA ovarian serous cystadenocarcinoma dataset. NLS = nuclear localizing site; OD = oligomerization domain. (b,c) Distribution of p53 IHC staining and NGS mutation concordance rate. Chi-square test.

