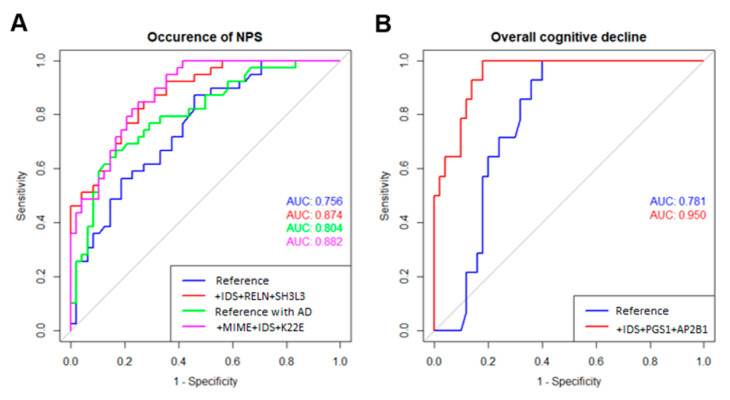
Figure 4.
ROC curve comparison for the reference and selected diagnostic models. (A) ROC curves and AUCs for the reference models (sex + age + MMSE score) with (green) or without considering cerebral AD (blue) and the final diagnostic models of the occurrence of NPS obtained after addition of three proteins (IDS + RELN + SH3L3) without AD (red) and three proteins (MIME + IDS + K22E) with AD (magenta). (B) ROC curves and AUCs for the reference model (age + sex+ baseline MMSE score + time to follow-up + cerebral AD status (blue)) and the final diagnostic model of decline in global cognition (MMSE change at last follow-up <−2) after addition of three proteins (IDS + PGS1 + AP2B1).

