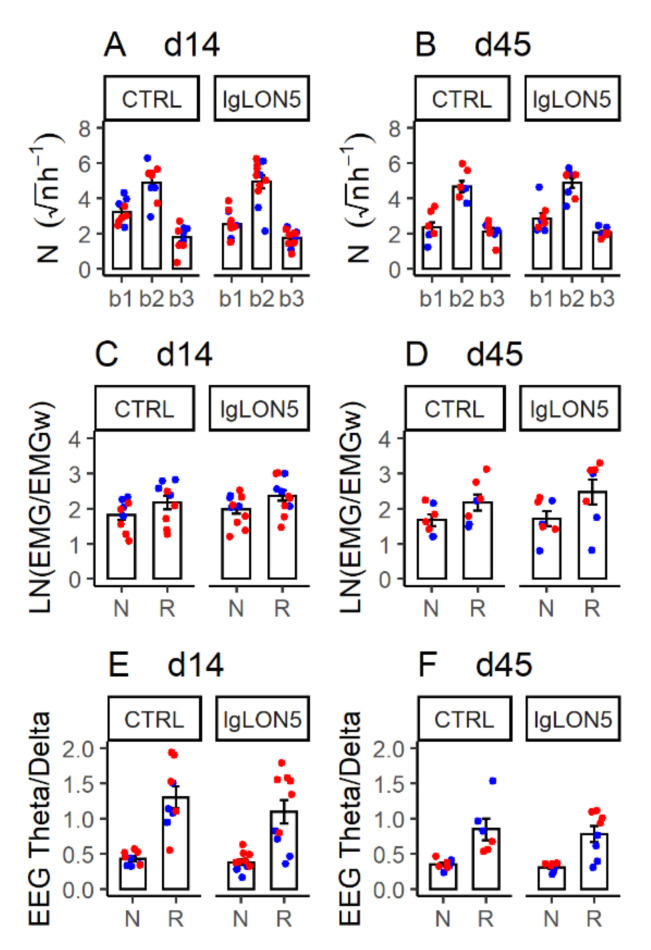
Figure 5.
Indexes of sleep architecture (A,B) and quality (C,F) in female wild-type (blue) and hTau (red) mice with intracerebroventricular infusion of antibodies from a patient with anti-IgLON5 disease (IgLON5) or from a control (CTRL) subject. (A,B): square-root transformed numbers of episodes of NREM sleep with duration 4–8 s (b1), 12–120 s (b2) or >120 s (b3) per hour recording time during the first 8 h of the light period. (C,D): log-transformed ratios of electromyogram (EMG) root mean square during sleep (N: NREM sleep; R: REM sleep) and during wakefulness (EMGw). (E,F): ratios of electroencephalogram (EEG) theta and delta power during N and R. (A,C,E): data obtained at the end of the 14-day infusion (d14). (B,D,F): results obtained ≥ 1 month afterward (d45). Bars show means ± SEM. Dots show values in individual mice. Detailed statistical results are reported in Table A5, Table A6 and Table A7.

