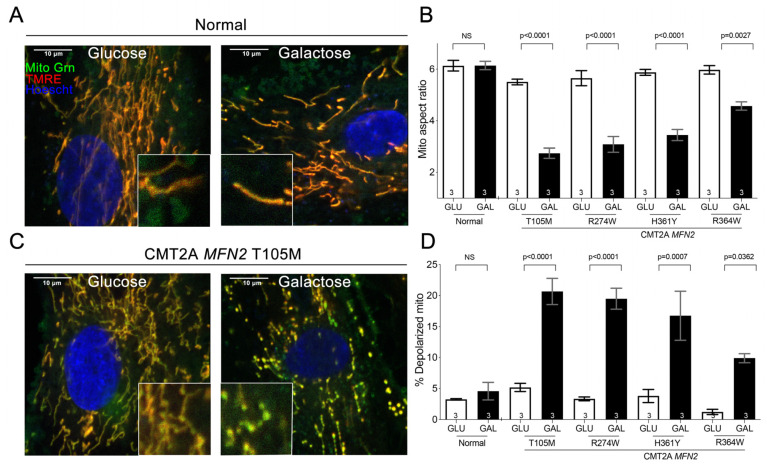
Figure 1.
Redirecting fibroblast metabolism with galactose provokes mitochondrial pathology in CMT2A. (A,C). Representative confocal images of normal (A) and CMT2A (MFN2 T105M) patient (C) fibroblasts cultured in glucose or galactose; Mito Tracker Green (green), TMRE (red), Hoechst (blue). Insets show images further magnified for clarity. Healthy mitochondria are yellow/orange; depolarized mitochondria are green. Scale bars are 10 microns. (B,D). Quantitative group data for normal and CMT2A patient fibroblast mitochondrial aspect ratio (B) and depolarization (D). Data are means ± SEM; statistics by two-way ANOVA, p values are at the top of the bars. NS = Nonsignificant. The number of independent experiments is shown on the bottom of each bar.

