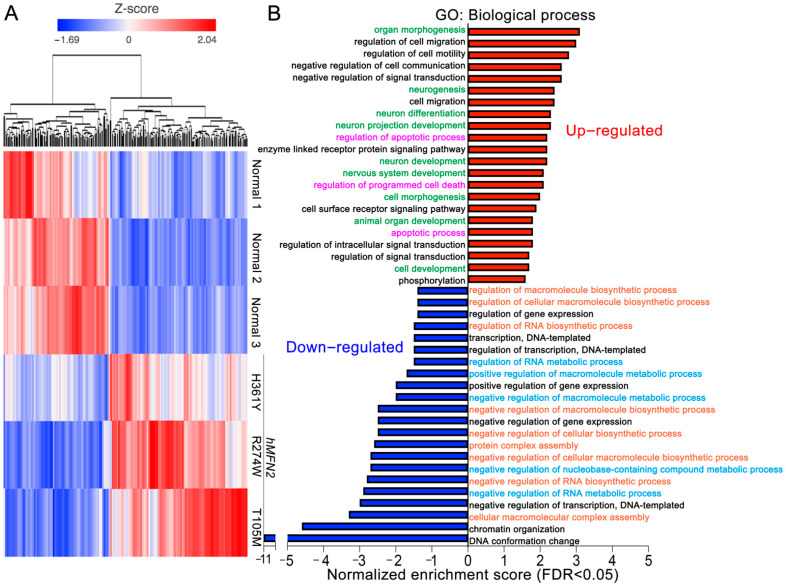
Figure 2.
CMT2A patient fibroblasts have a distinct transcriptional signature. (A) Heat map results for unsupervised hierarchical clustering of 613 regulated mRNAs; red indicates increased expression, blue indicates decreased expression. mRNA counts in CMT2A vs. normal cells were pre-filtered for CPM ≥ 10 in at least one sample, fold change > (±) 1.5, p < 0.05. (B) Gene ontology analysis of the top 100 up- (red) and down- (blue) regulated mRNAs. Same color text indicates common pathways.

