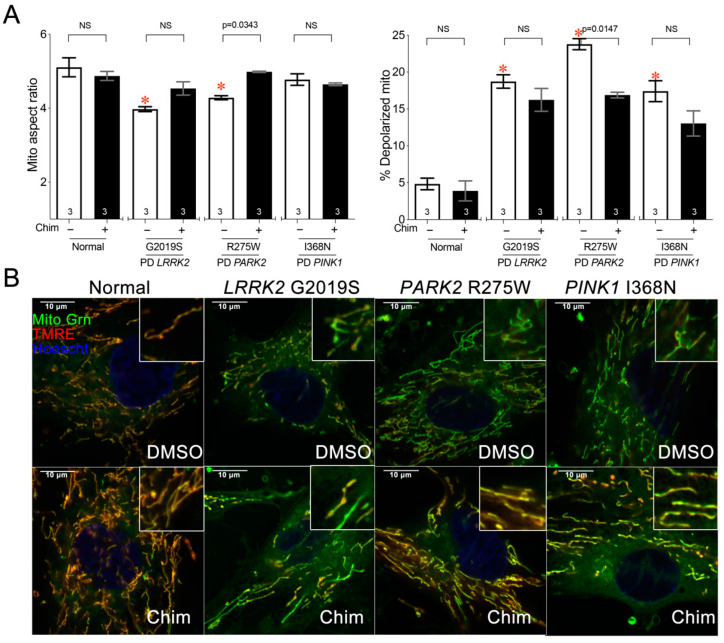
Figure 4.
PARK R275W Parkinson’s disease fibroblasts exhibit mitochondrial depolarization that is improved by mitofusin activation. (A) Quantitative results for mitochondrial aspect ratio (left) and depolarization (right) of galactose-cultured normal and PD patients’ fibroblasts treated with 100 nM Chimera or DMSO vehicle. Data are means ± SEM; p values by two-way ANOVA; * = p < 0.05 vs. vehicle-treated normal fibroblasts; individual p values are given for Chimera vs. vehicle within each genotype. NS = Nonsignificant. The number of independent experiments is shown on the bottom of each bar. (B) Representative confocal images of studies in panel (A); staining and imaging as in Figure 1.

