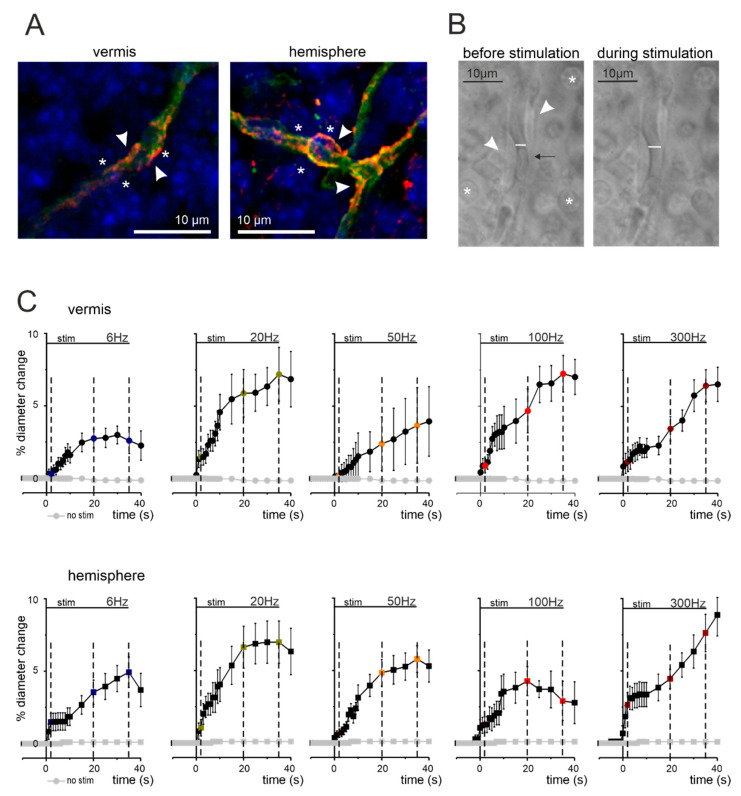
Figure 1.
Anatomo-physiological correlations of NVC in the cerebellar granular layer. (A) Confocal fluorescent images of cerebellar slices stained for IB4 (green), NG2 (red), and DAPI (blue) to identify capillaries, pericytes, and cell nuclei, respectively. In both vermis and hemisphere, granule cells (asterisks) are in proximity of pericytes (arrowheads) located on capillary endothelium (green). (B) Bright-field images taken before and during mossy fiber stimulations at 50 Hz (vermis). The pericytes (arrowheads) are visible near granule cells (asterisks) and the capillary walls can be easily identified. The internal diameter changes in response to stimulation (white bar). The arrow indicates a red blood cell that moves inside the capillary as a consequence of blood vessel motility. (C) Average time courses of capillary dilation during mossy fibers activation at different frequencies in vermis and hemisphere. The figure shows the average percent change in capillary diameter size in the different conditions tested for the vermis lobule V and hemisphere lobule VI. Mossy fibers were stimulated for 35 s at 6, 20, 50, 100, and 300 Hz (stim bar). The dashed lines indicate the time points at 2, 20, and 35 s, used to analyze dilation in the subsequent analysis. In each panel, the dilation at the end of stimulus was significantly different compared to pre-stimulus baseline (see Table S1 in Supplementary Materials). In both panel sets, grey dots represent stability recordings in which stimulation was not delivered (n = 8).

