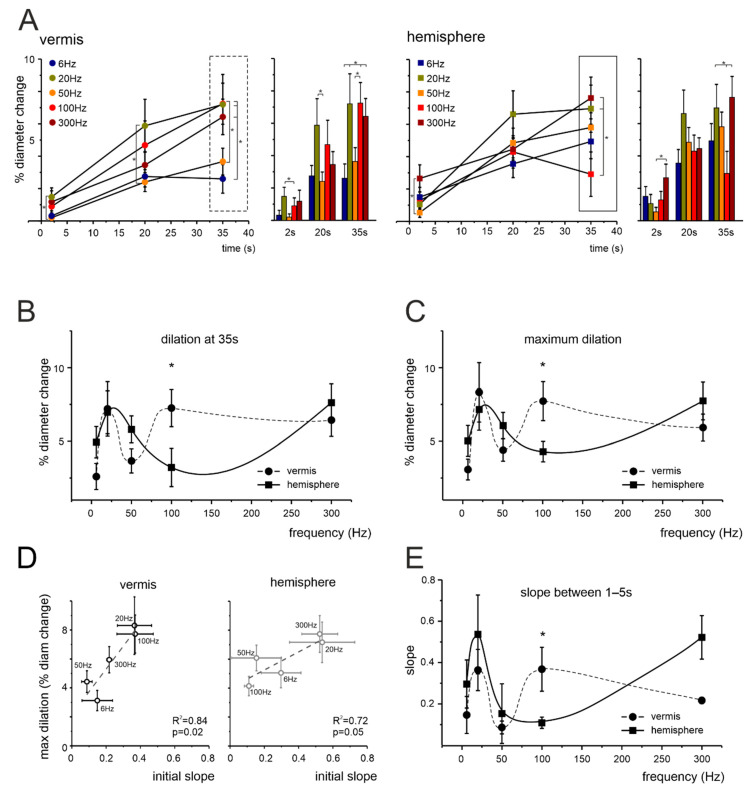
Figure 2.
NVC frequency dependence in the cerebellar granular layer. (A) Average time course of vasodilation during mossy fibers stimulation at 2, 20, and 35 s in capillaries of the vermis and hemisphere. Asterisks indicate pairs of points that were statistically different (* p < 0.05). Vermis: 2 s, 20 Hz vs. 50 Hz (p = 0.039); 20 s, 20 Hz vs. 50 Hz (p = 0.0358); 35 s, 6 Hz vs. 100 Hz (p = 0.014), 50 Hz vs. 100 Hz (p = 0.049), 6 Hz vs. 20 Hz (p = 0.015), 6 Hz vs. 300 Hz (p = 0.036) (one-way ANOVA; for increasing frequencies n = 9, 10, 10, 10, 11, respectively). Hemisphere: 2 s, 50 Hz vs. 300 Hz (p = 0.029); 35 s, 100 Hz vs. 20 Hz (p = 0.024), 100 Hz vs. 300 Hz (p = 0.009) (one-way ANOVA; for increasing frequencies n= 9, 10, 10, 10, 10, respectively). The box markers show the data that are used for plots in (B), unfolded along the x-axis. (B) Average dilations at 35 s at each frequency tested in the vermis and hemisphere (dots and squares, respectively, connected by trend lines). The dilations in the vermis and hemisphere were statistically different at 100 Hz (p = 0.039). (C) Same plot as in (B), using the maximum dilation instead of the dilation at a fixed time point. The dilations in the vermis and hemisphere were statistically different at 100 Hz (p = 0.022). (D) The plots show the positive correlation between the maximum dilation at each frequency and the slope in the first 1–5 s, for the vermis (left) and hemisphere (right). (E) Same plot as in (B,C), using the slope in the first 1–5 s as a function of stimulation frequency. The slopes in the vermis and hemisphere were statistically significant at 100 Hz (p = 0.031).

