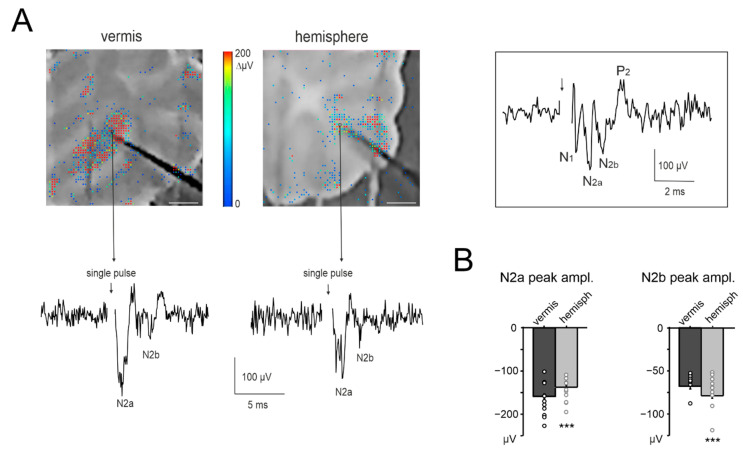
Figure 3.
NA recordings in the cerebellar granular layer. (A) Example of a vermis and hemisphere cerebellar slice placed on the HD-MEA biochip (scale bar 0.5 mm). The activity following single-pulse stimulation of mossy fibers is superimposed in a color-scale (2 ms bin). A representative trace is shown from the HD-MEA biochip channel indicated by the arrow. The stimulus intensity and stimulating electrode is the same as used in Figure 1B. The inset shows the entire N1-N2a-N2b-P2 complex that comprises the classic LFP in the granular layer (see Methods for details). (B) The histograms show the average peak amplitude of N2a and N2b, for both the vermis and hemisphere (n = 10 slices for both) and the single data points. Statistical significance is indicated by asterisks (*** p < 0.001).

