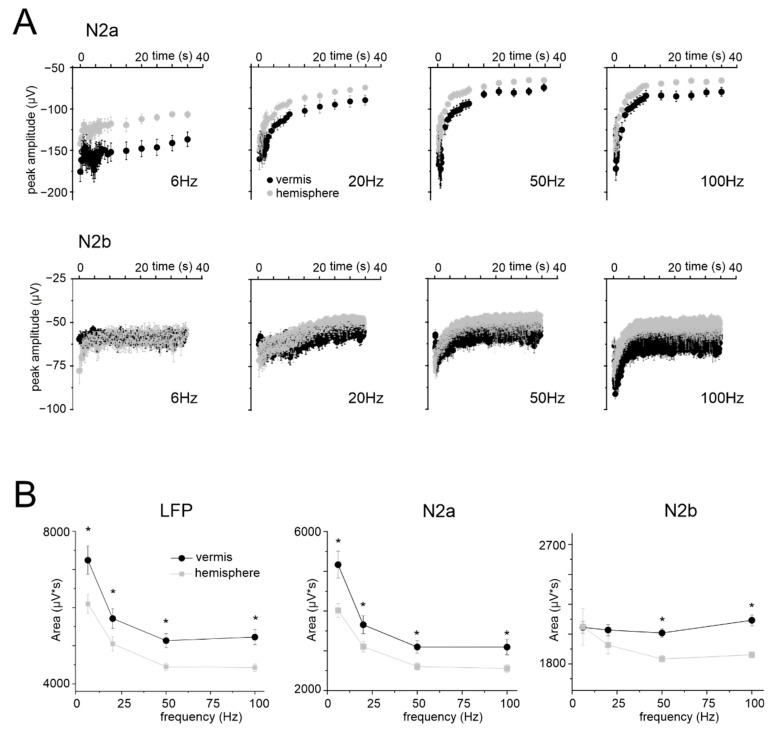
Figure 4.
Time and frequency dependence of LFPs during stimulation. (A) The plots show the time course of N2a and N2b peak amplitude in response to stimulation at different frequencies, recorded in 10 vermis and 10 hemisphere slices (the responses in the right part of the N2a plots are down-sampled). (B) Frequency dependence of the average cumulative LFP response, N2a and N2b measured at 35 s during stimulation at different frequencies in the vermis (n = 10) and hemisphere (n = 10) (same slices as in panel (A)). Statistical significance is indicated by asterisks (* p < 0.05).

