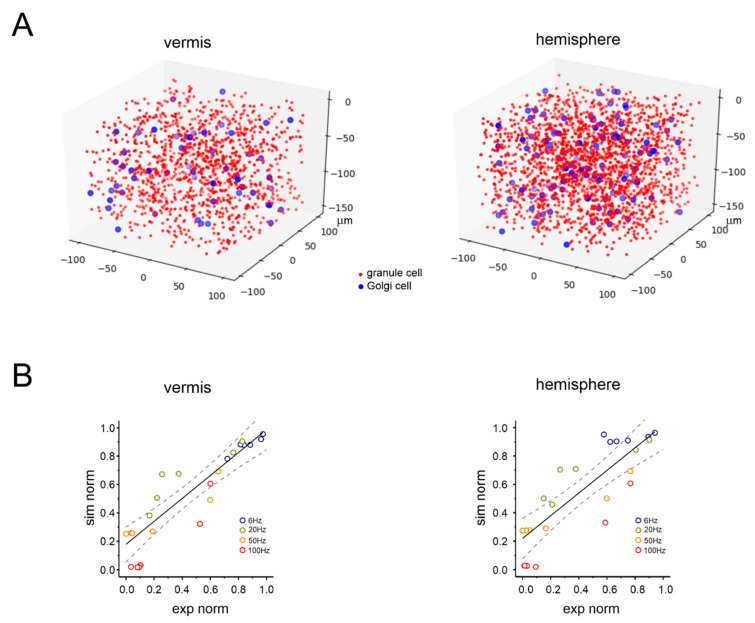
Figure 5.
Realistic computational modeling of granular layer response in the vermis and hemisphere. (A) Schematic illustration of the spatial distribution of granule cells (red dots) and Golgi cells (blue dots) in a volume chunk of the granular layer (100 µm3) of the cerebellar vermis and hemisphere in a realistic computational model derived from 45. For better rendering, granule cells are down-sampled by a factor of 20. There are 1203 granule cells and 55 Golgi cells for the vermis, 1980 granule cells and 113 Golgi cells for the hemisphere. (B) Computational model validation against the experimental data for the vermis and hemisphere. The plot shows the distribution of normalized response amplitude experiments (N2a peak amplitude) and simulations using the same stimulation frequency. The time points considered for model validation are 1, 2, 10, 20, 25, and 35 s. The simulated frequencies are the same as those used in the experiments. The black lines are linear fittings (vermis: slope 0.81, R2 0.73, p < 0.001; hemisphere: slope 0.80; R2 0.70, p < 0.001), the dashed lines are 95% confidence intervals.

