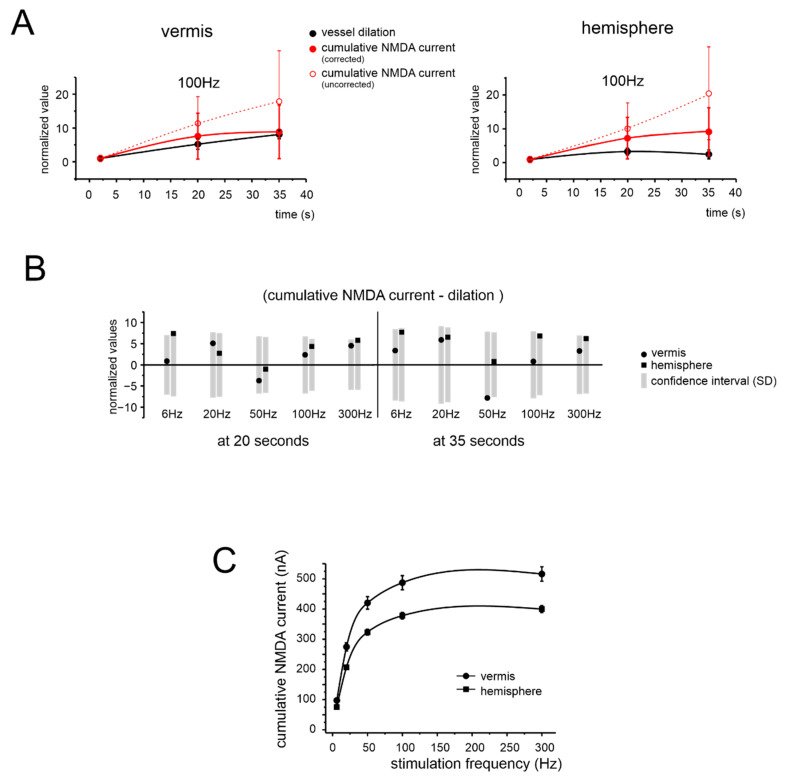
Figure 6.
Comparison of simulated NMDA currents in granule cells and blood vessel changes. (A) Time course of the granule cells’ cumulative NMDA current during 100 Hz stimulation and of the corresponding vessel response, for the vermis and hemisphere. The plot shows both the corrected and uncorrected NMDA component (see text for details). All data are normalized to amplitude at 2 s. (B) The bar graph shows the difference between the normalized values of simulated NMDA components and vessel dilation at 20 and 35 s at all tested frequencies, for the vermis and hemisphere. The grey rectangles represent the normalized confidence interval (±1SD) yielded by model simulations of the NMDA current. Notice that all data points fall within the confidence interval, both for the vermis and hemisphere. (C) Frequency dependence of the cumulative NMDA currents measured at 35 s, for the vermis and hemisphere. This panel should be compared to the corresponding one for vasodilation (cf. Figure 2B).

