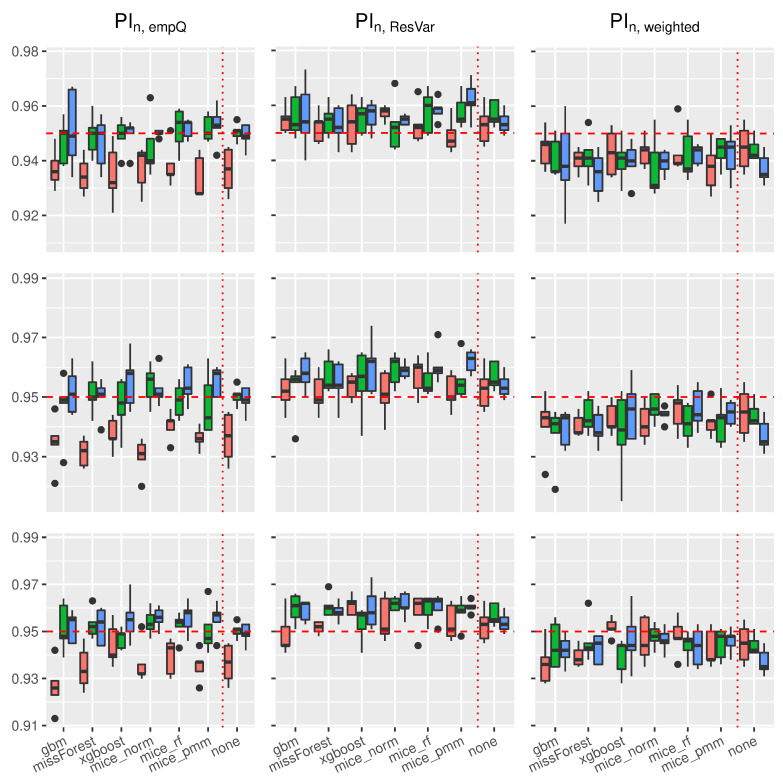
Figure 5.
Boxplots of prediction coverage rates under the trigonometric model. The variation is over the different covariance structures of the features. Each row corresponds to one of the missing rates , while each column corresponds to the following prediction intervals: , and . The triple (red, green and blue) correspond to the sample sizes .

